


BY EMMET GARDNER
OUSD’s district-run schools lost more enrollment than other nearby school districts
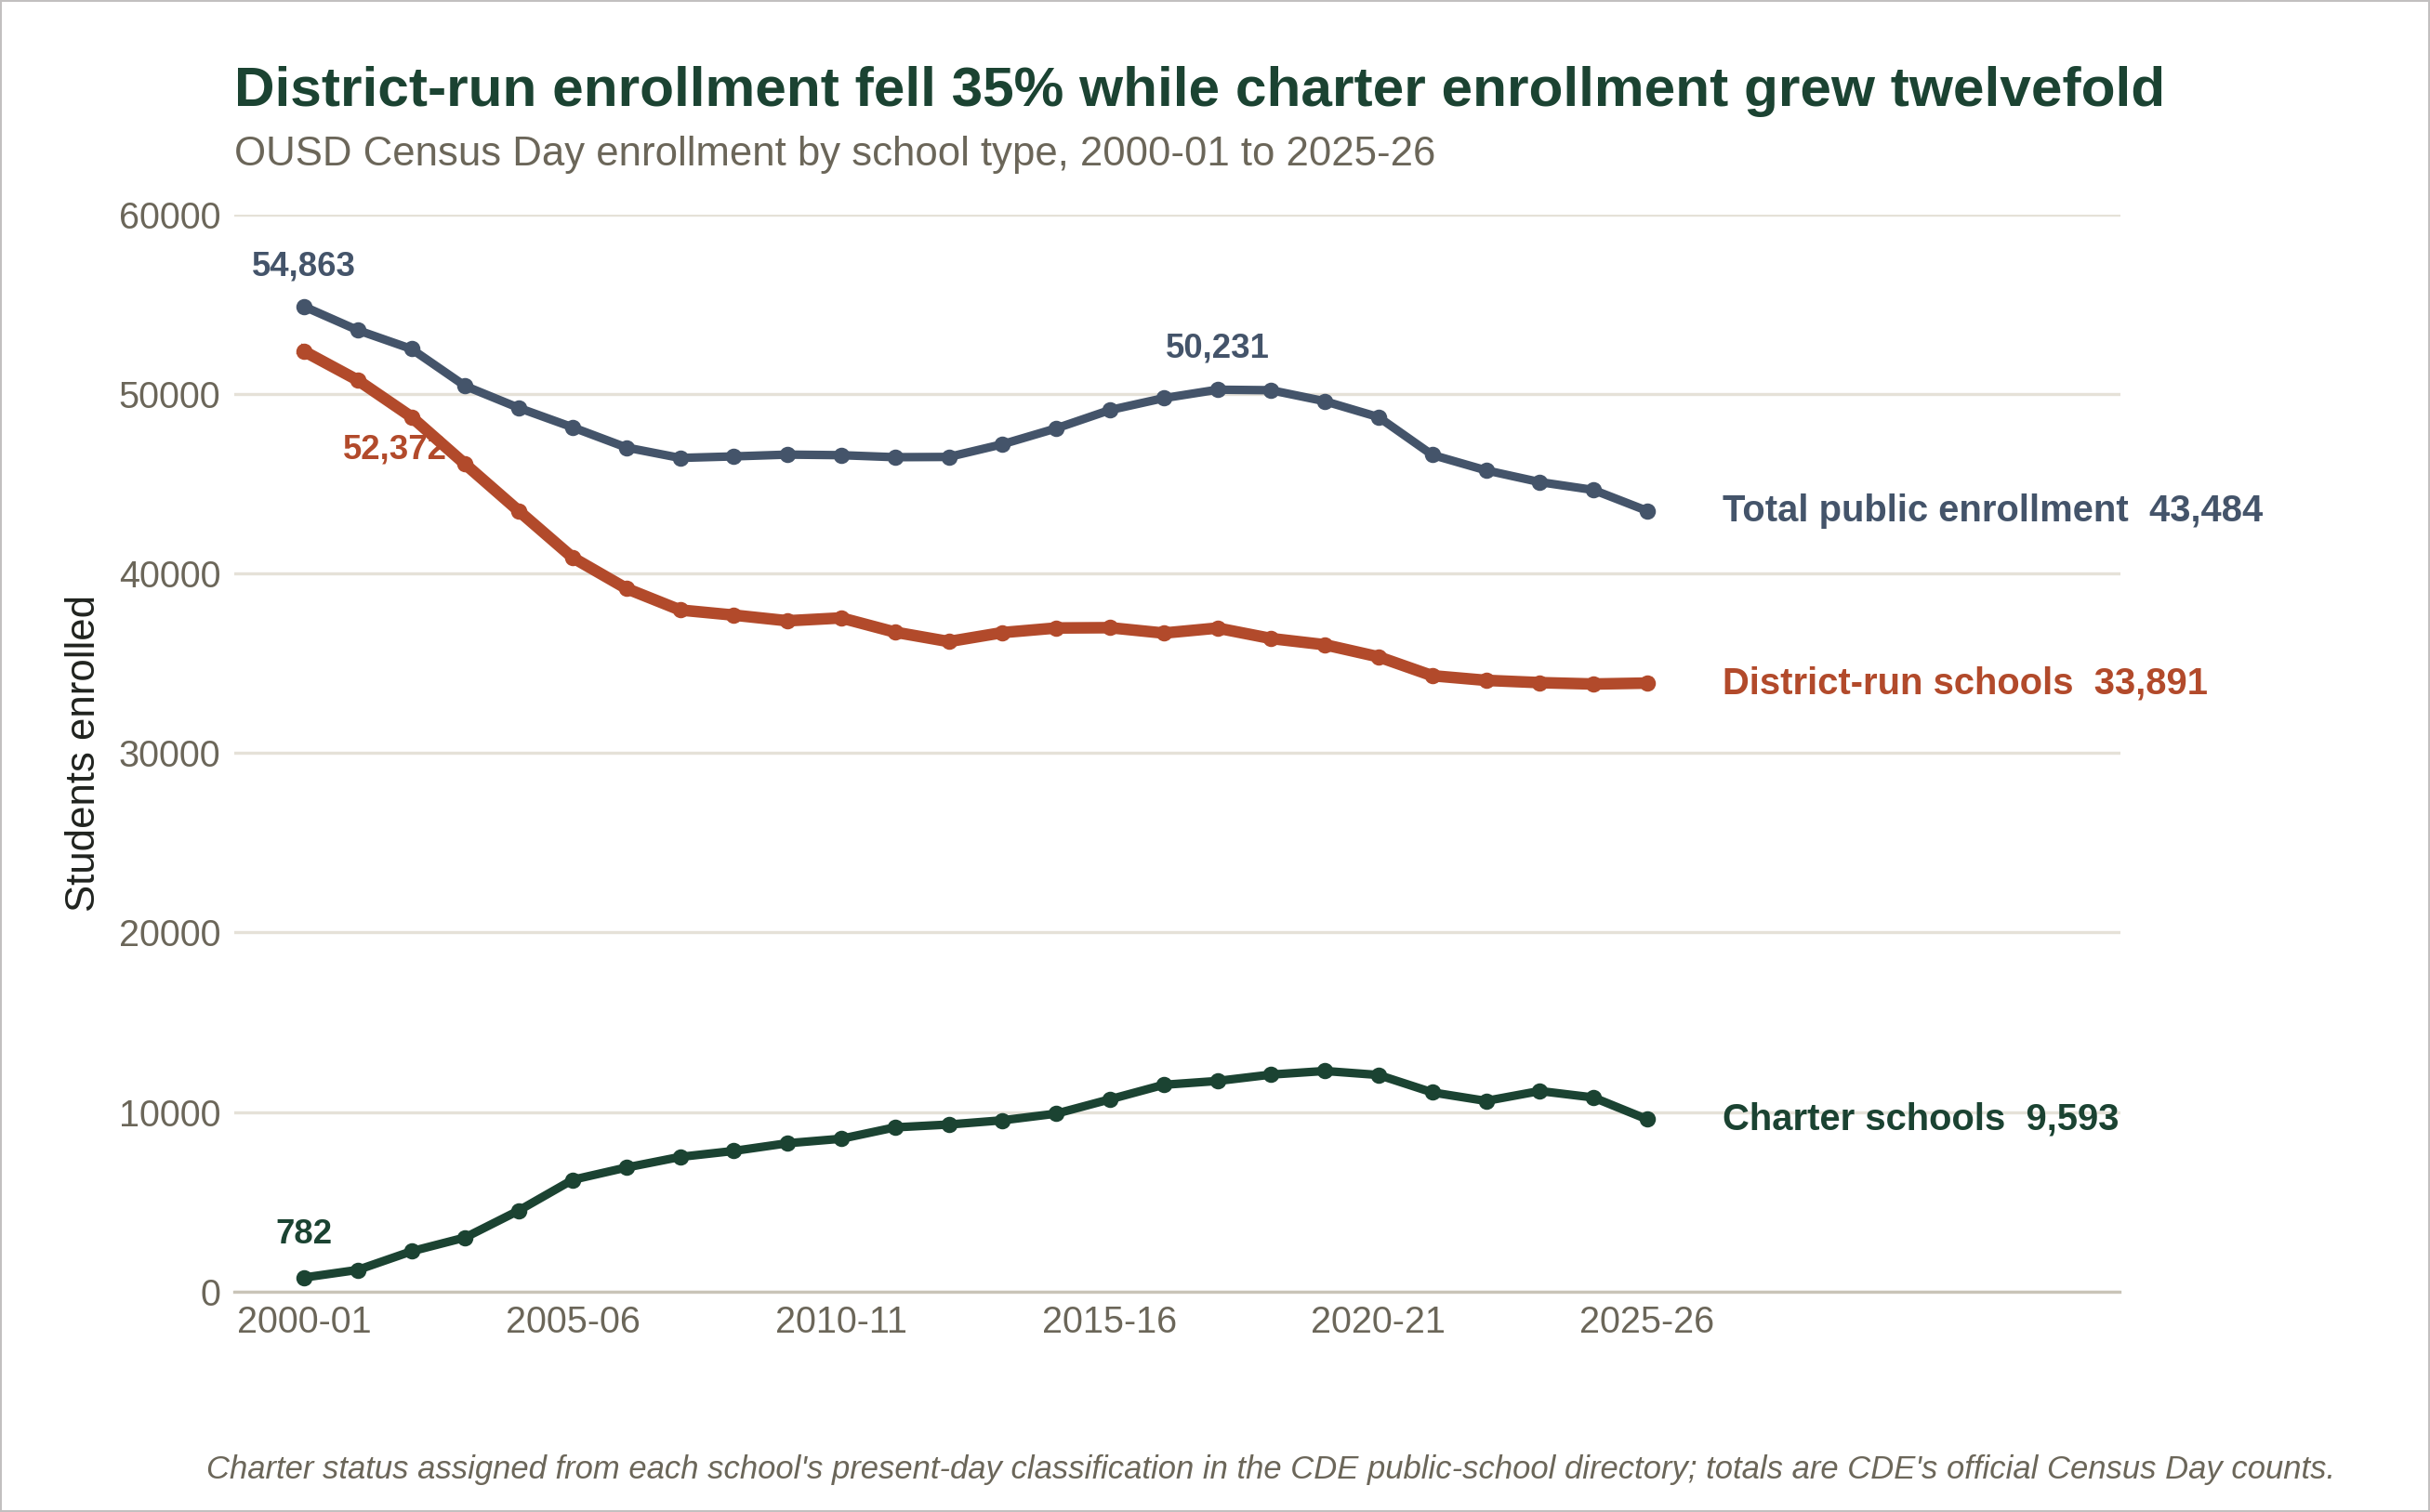
Over the past two-and-a-half decades, Oakland Unified School District (OUSD) has lost more students than any nearby district.
OUSD enrolled around 43,500 public school students in 2025-26 — approximately 11,400 fewer than in 2000-01.
Most of that 25-year loss happened in Oakland’s district-run (non-charter) public schools. Excluding charter schools, enrollment at OUSD-run schools fell 35%.
OUSD officials blame falling birth rates, families moving away, and competition from charter and private schools.12
To test the effects of falling birth rates — a nationwide trend — Oakland Report examined 25 years of California Department of Education (CDE) enrollment records.3
We also examined U.S. Census Bureau population data for OUSD and six nearby districts: Alameda, Berkeley, Castro Valley, Emery, Piedmont City and San Leandro.45
The bottom line: District-run enrollment in Oakland fell far more than the number of school-age children living here — pointing to forces beyond demographics.
Key findings
OUSD’s district-run schools lost over 35% of their students since 2000.
Oakland’s population of school-aged children fell only an estimated 23%.
Statewide, California’s kids ages 5-17 fell just 2.8% (2000-2020).
Charter schools now enroll 22% of Oakland’s public school students.
Roughly 1 in 5 school-age Oakland kids do not attend Oakland public schools.
No nearby district lost more students than OUSD.
Oakland’s school-age population fell an estimated 23% from 2000 to 2024 — far more than the statewide decline
Birth rates and population are not the same: population also changes as families move in or out, so we compared enrollment against both.
The population measure we used for school-age children is residents ages 5 to 17 — the closest Census age range to K-12 school age.
Birth rate: Statewide, California recorded 531,285 live births in 2000. After a peak in the late 2000s, the annual total has fallen to under 420,000 — a drop of more than 111,000 births, or about 21%.67
School-age population: California’s ages 5-17 population fell just 2.8% between the 2000 and 2020 Censuses (6,762,848 to 6,573,679).
Even with continued statewide decline since, Oakland’s decline in ages 5-17 population was far greater: an estimated 23% from 2000 (73,030) to the 2024 estimate of 56,350.89
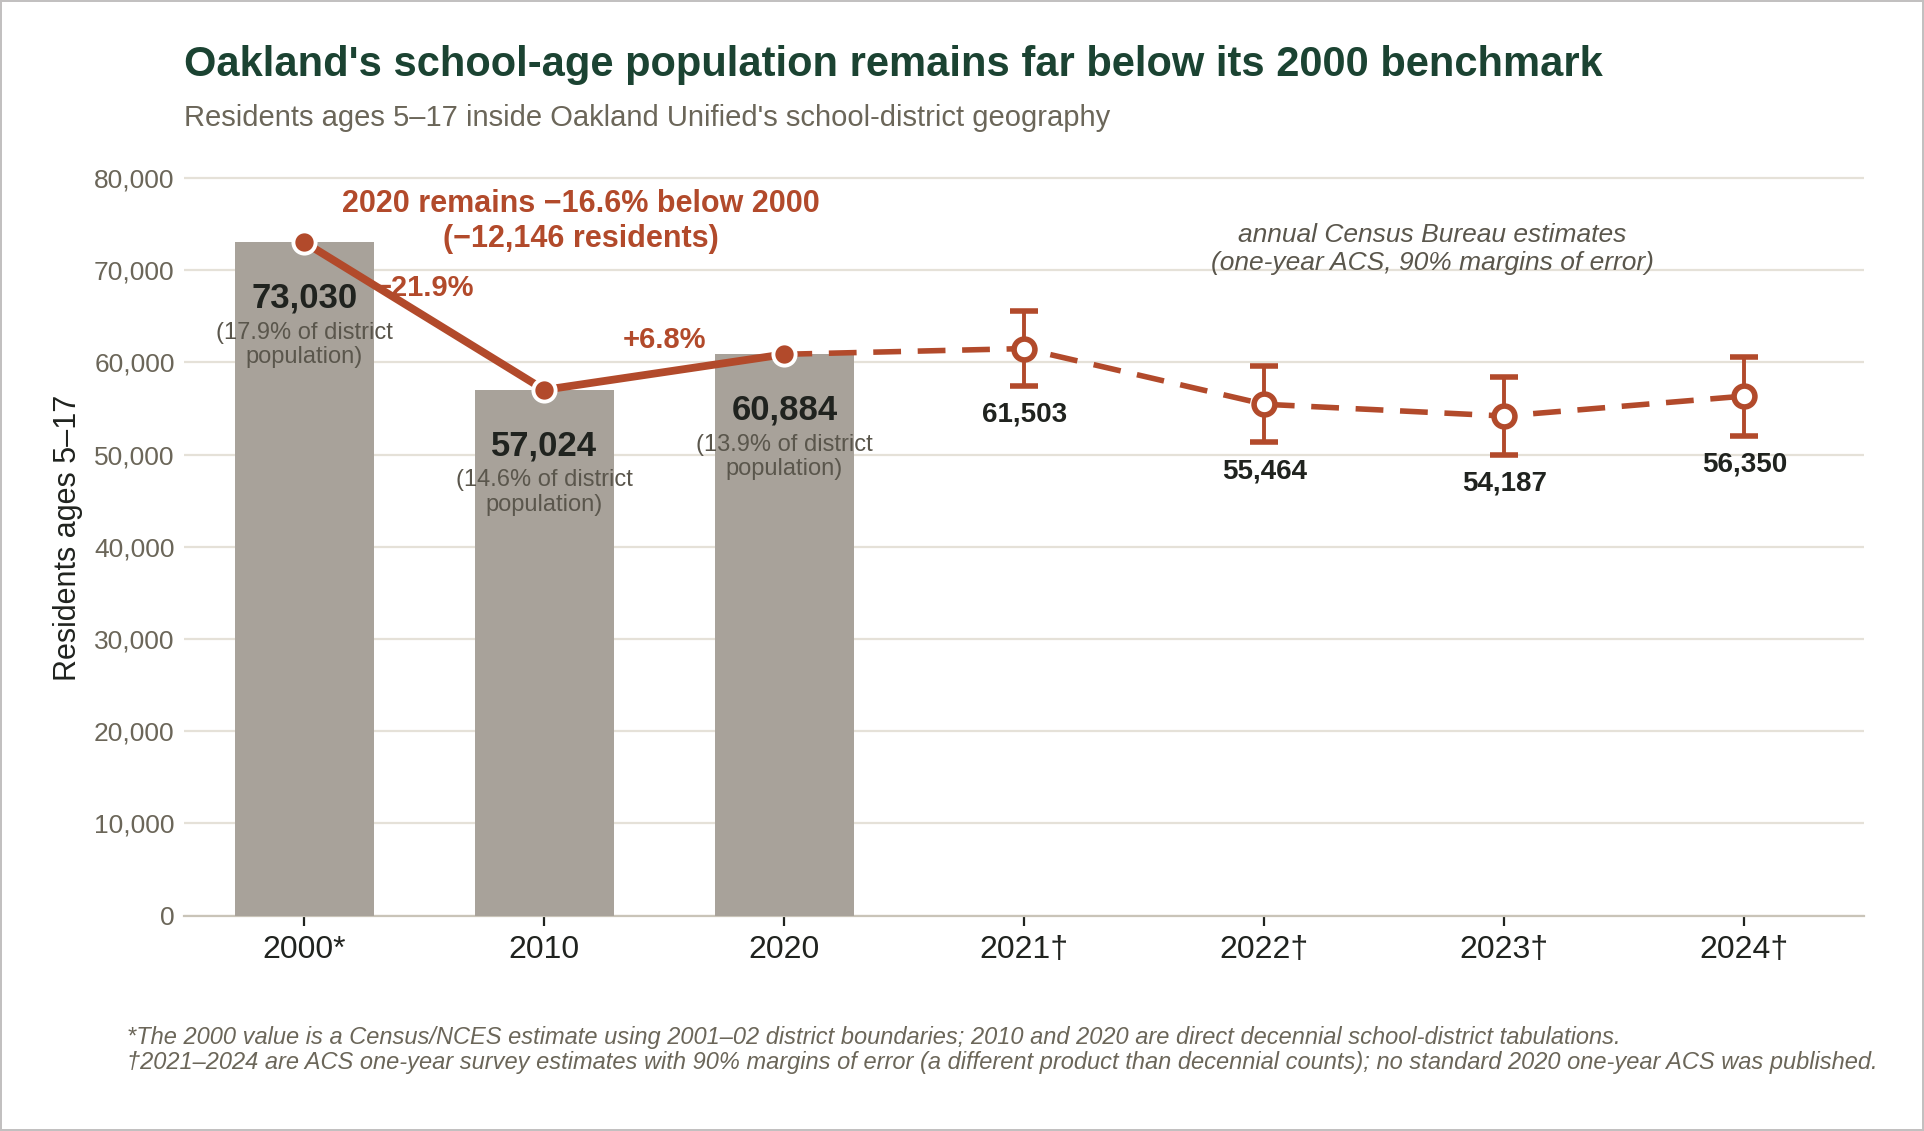
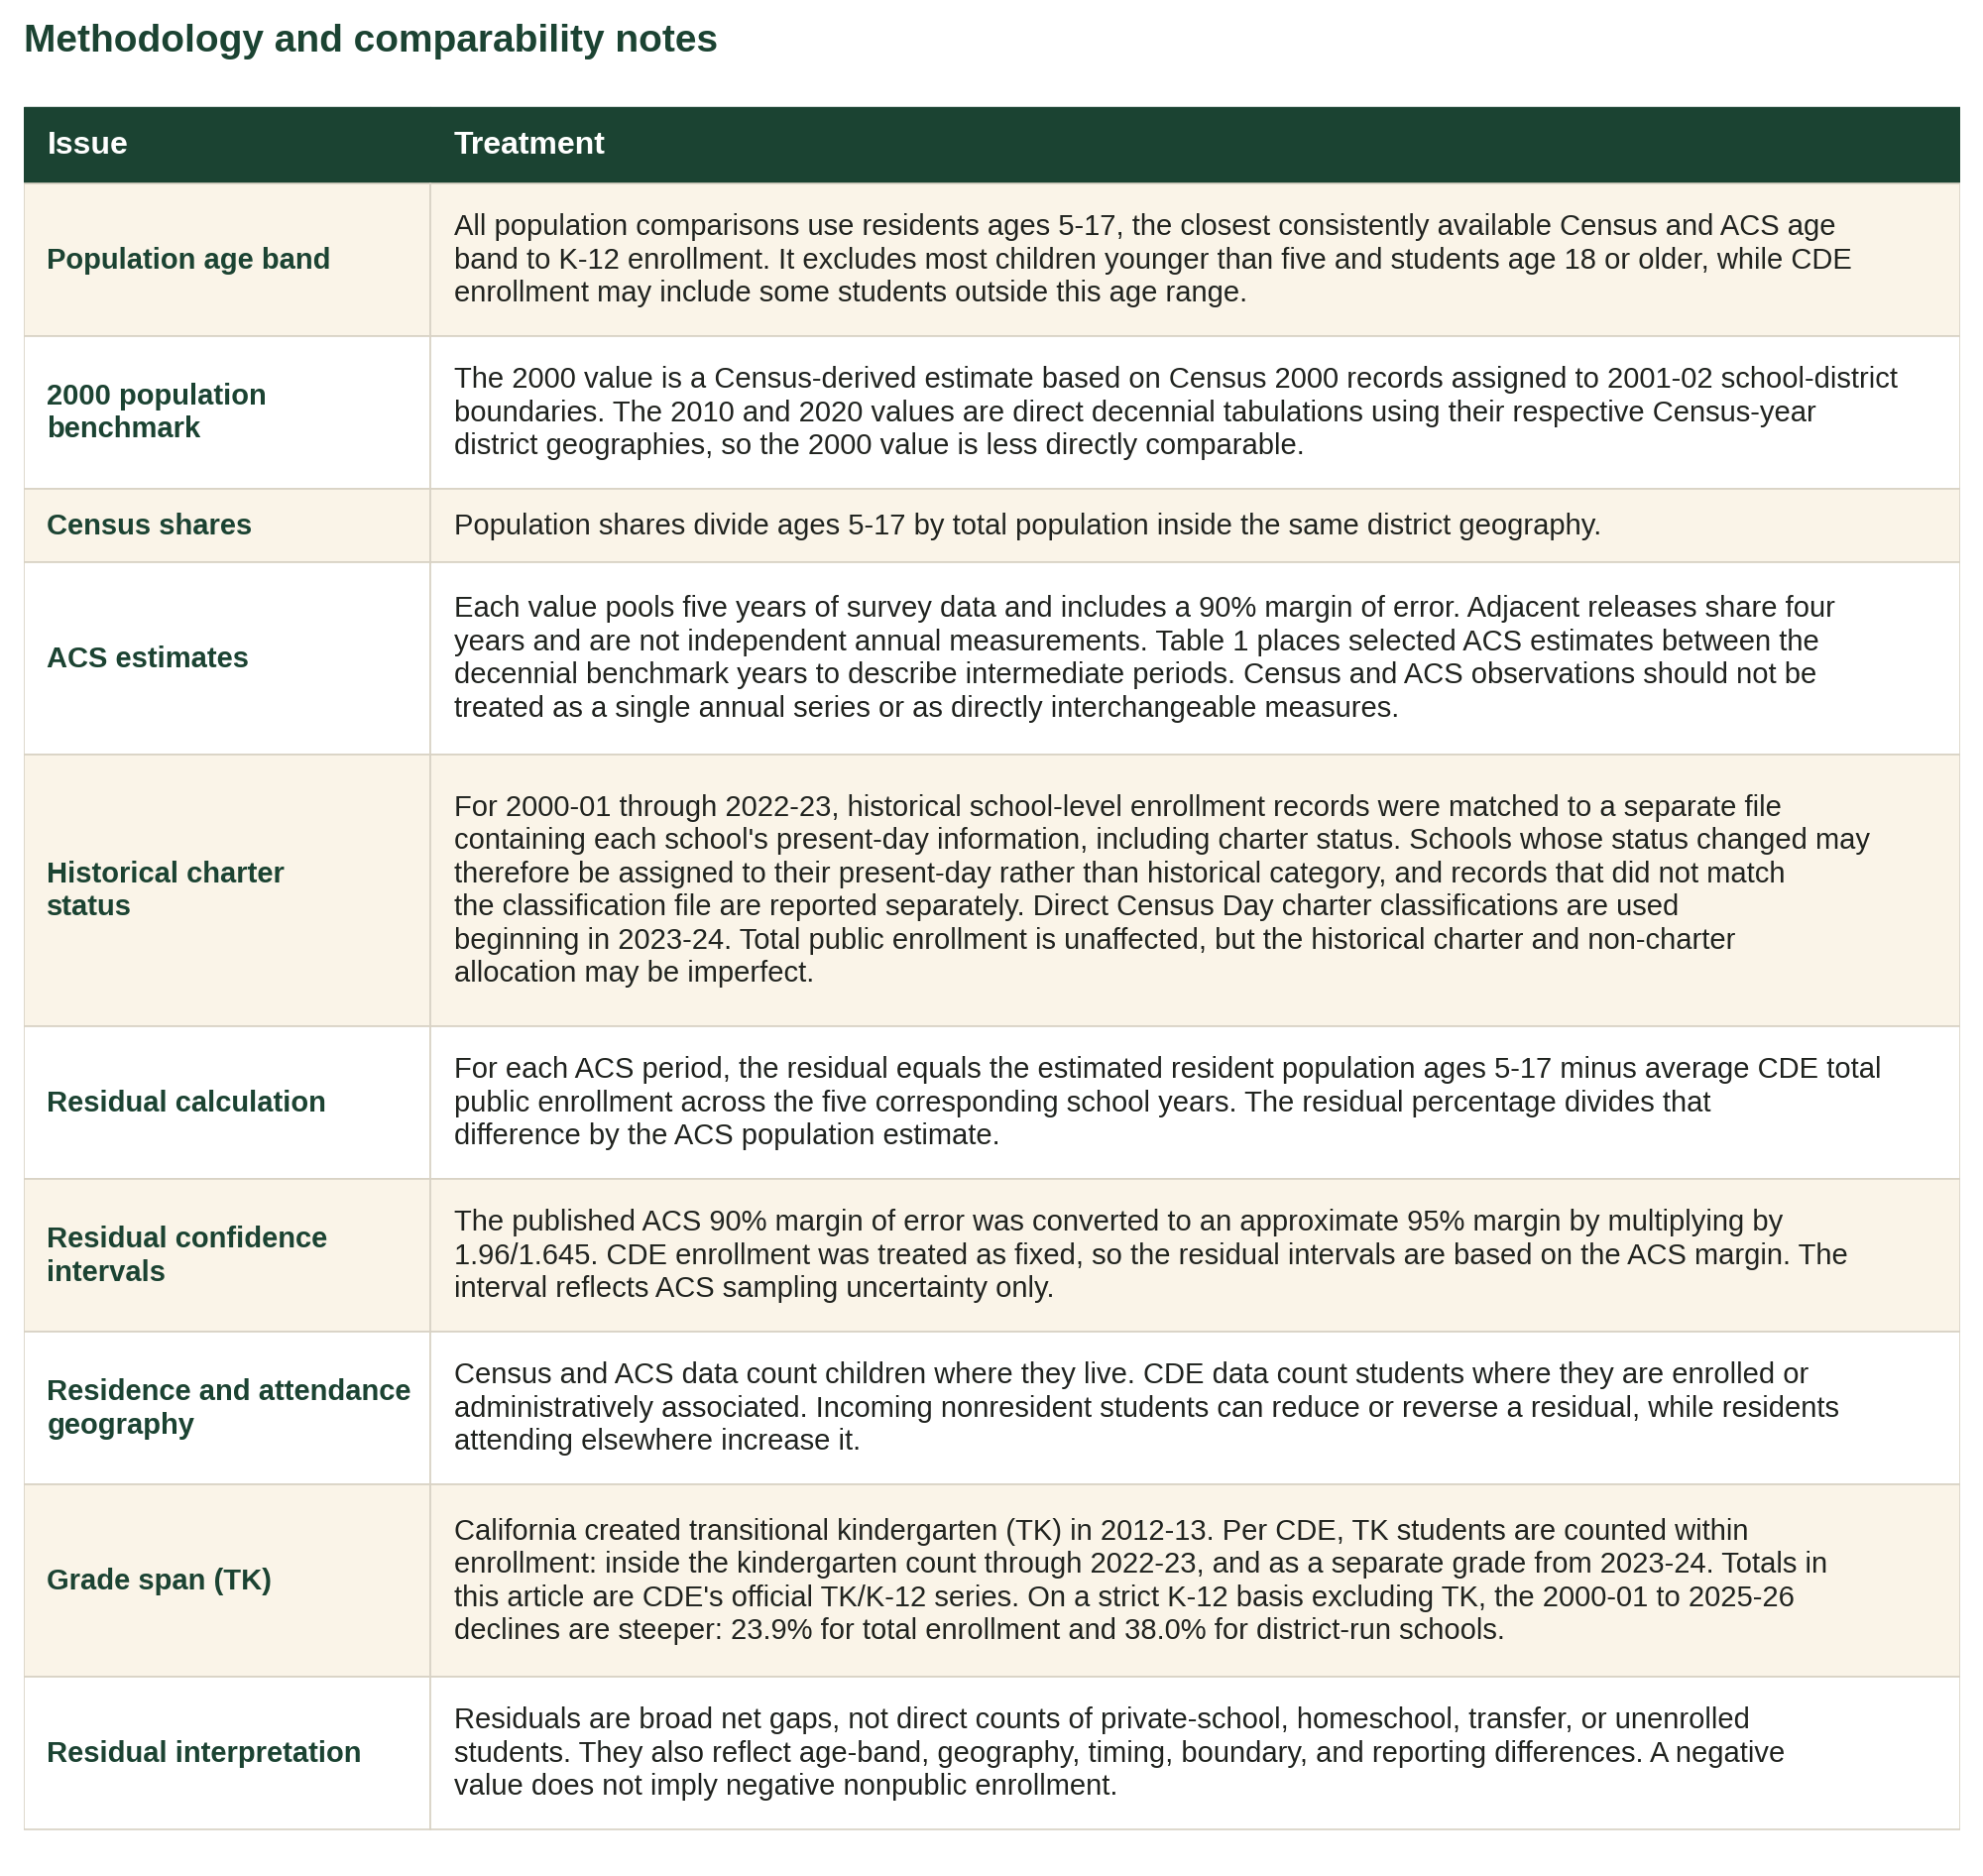
The 2000 figure is a Census-derived estimate using OUSD’s 2001-02 boundaries; 2010 and 2020 are direct counts, so the 2000 number is a benchmark rather than an exact match.
Since 2020, annual estimates suggest the school-age population is falling again: 61,503 (2021), 55,464 (2022), 54,187 (2023), 56,350 (2024), each with a margin of about ±4,000. The margins are wide, but the three most recent estimates — including the top of each range — all fall below the 2020 count of 60,884.
Oakland lost school-age population at a faster rate than neighboring districts
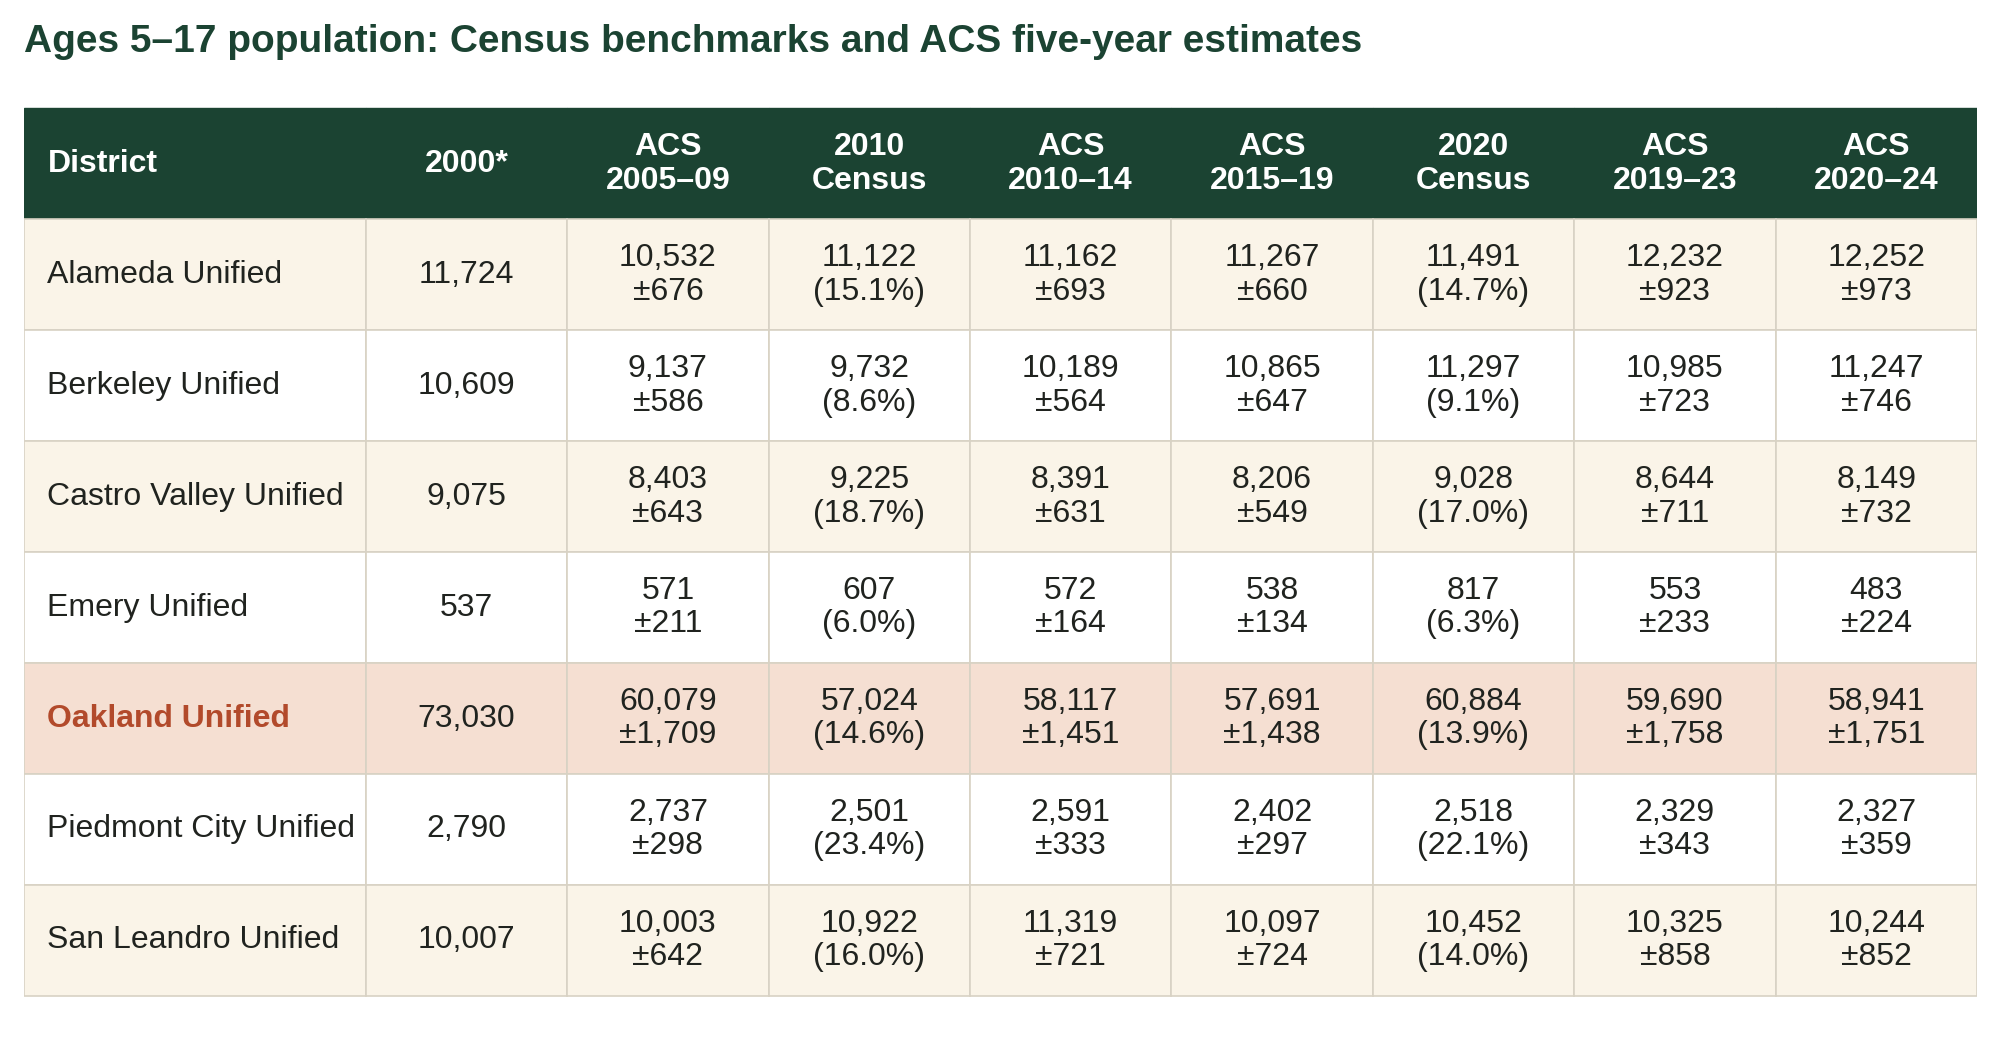
Comparing the 2000 benchmarks with the newest five-year estimates (ACS 2020-24), Oakland’s child population fell furthest: down 19.3% (73,030 to 58,941).
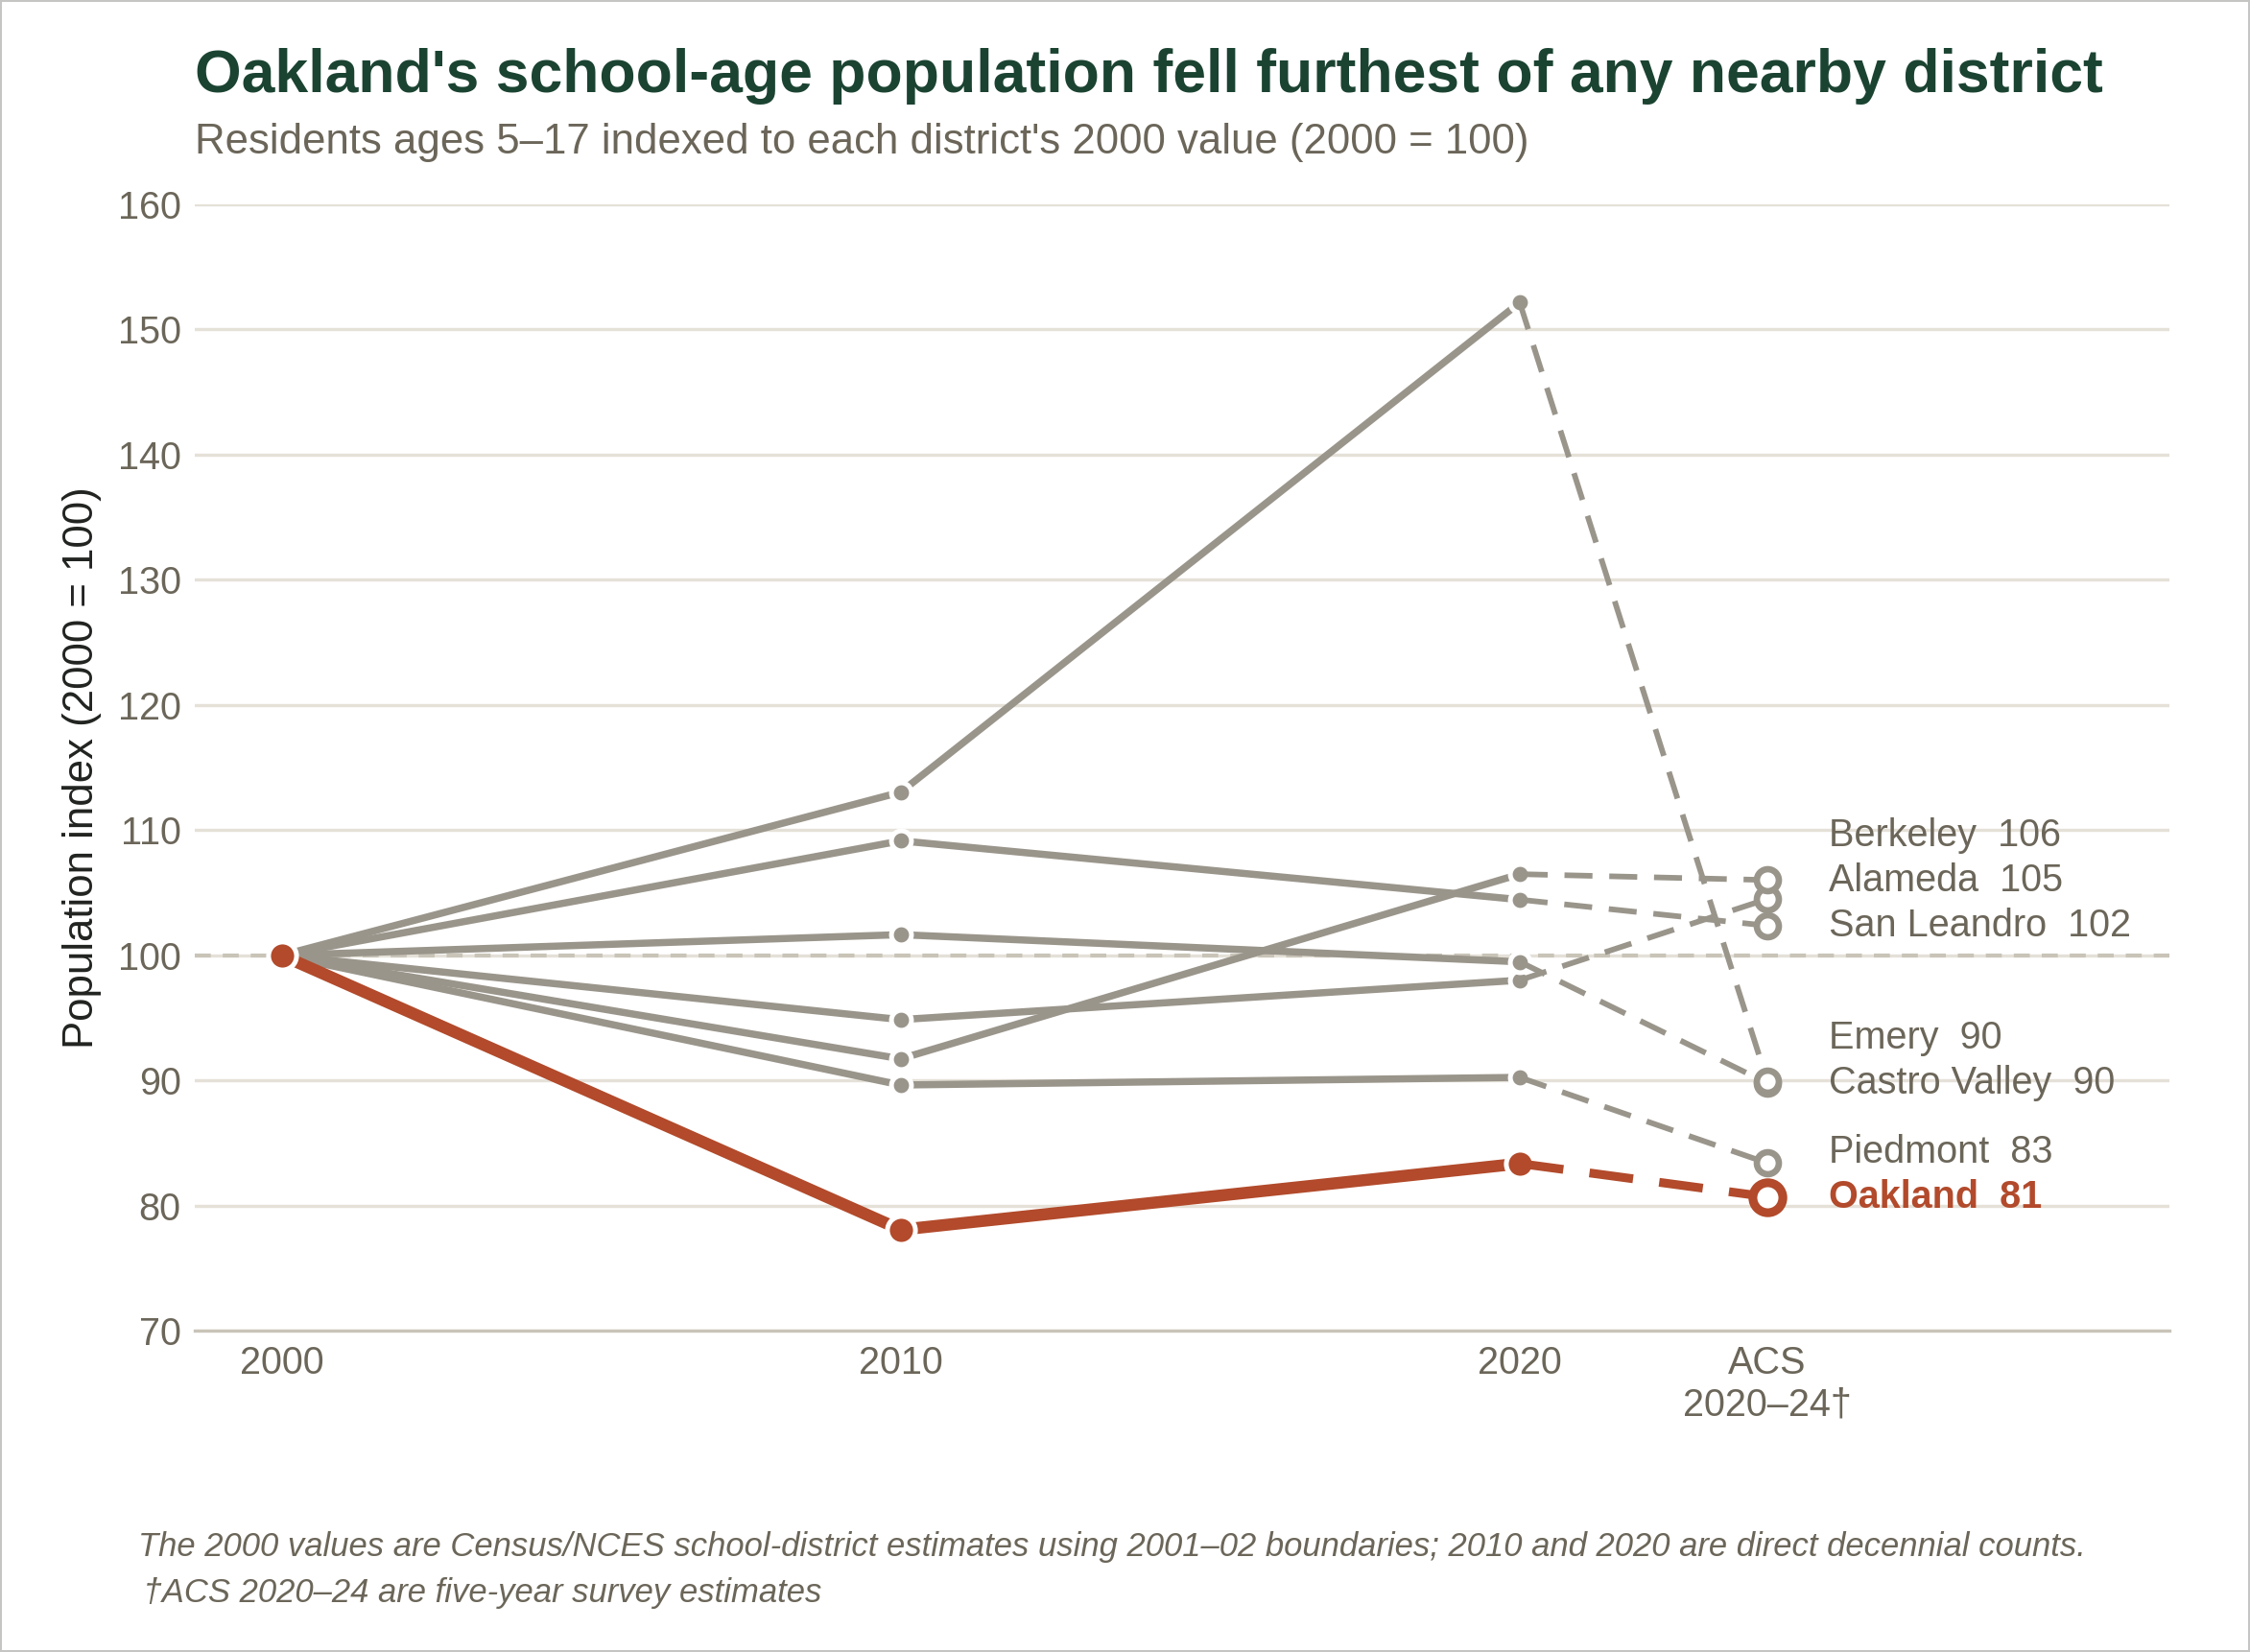
Piedmont fell 16.6% and Castro Valley and Emery each fell about 10% — though estimates for these small districts carry wide margins.
Berkeley (+6.0%), Alameda (+4.5%) and San Leandro (+2.4%) all ended above their 2000 levels.
Charter and district-run public school enrollment moved in opposite directions
OUSD’s total public school enrollment fell 21% — from 54,863 in 2000-01 to 43,484 in 2025-26.
Within that total, charter and district-run public school enrollment moved in opposite directions.
District-run (non-charter) enrollment fell 35% — from 52,372 to 33,891.
Charters were 1.4% of Oakland’s public enrollment in 2000-01; today they are 22%.
Of the 11,379-student total decline, district-run schools account for 18,481 lost students, partly offset by 8,811 added charter seats, with the balance in unmatched historical records.
OUSD’s enrollment decline is even steeper when excluding transitional kindergarten
California created transitional kindergarten (TK) in 2012-13, bringing new cohorts of younger, pre-kindergarten aged students into the public school system.
Recent enrollment data includes TK students while earlier data covers K-12 only. This article uses CDE’s official TK/K-12 totals, the conservative measure.
Oakland’s 2025-26 enrollment figures include 1,723 TK students.
Excluding TK students, OUSD’s enrollment decline is even steeper: a 24% decline in total enrollment and a 38% decline for district-run schools since 2000-01.
Oakland lost the most students of any nearby district; only much smaller Emery declined more proportionally
Comparing 2000-01 with 2025-26, the most recent school year: OUSD’s 21% decline (11,379 students) was the largest in absolute terms, and second-largest in percentage terms behind Emery’s 37%.
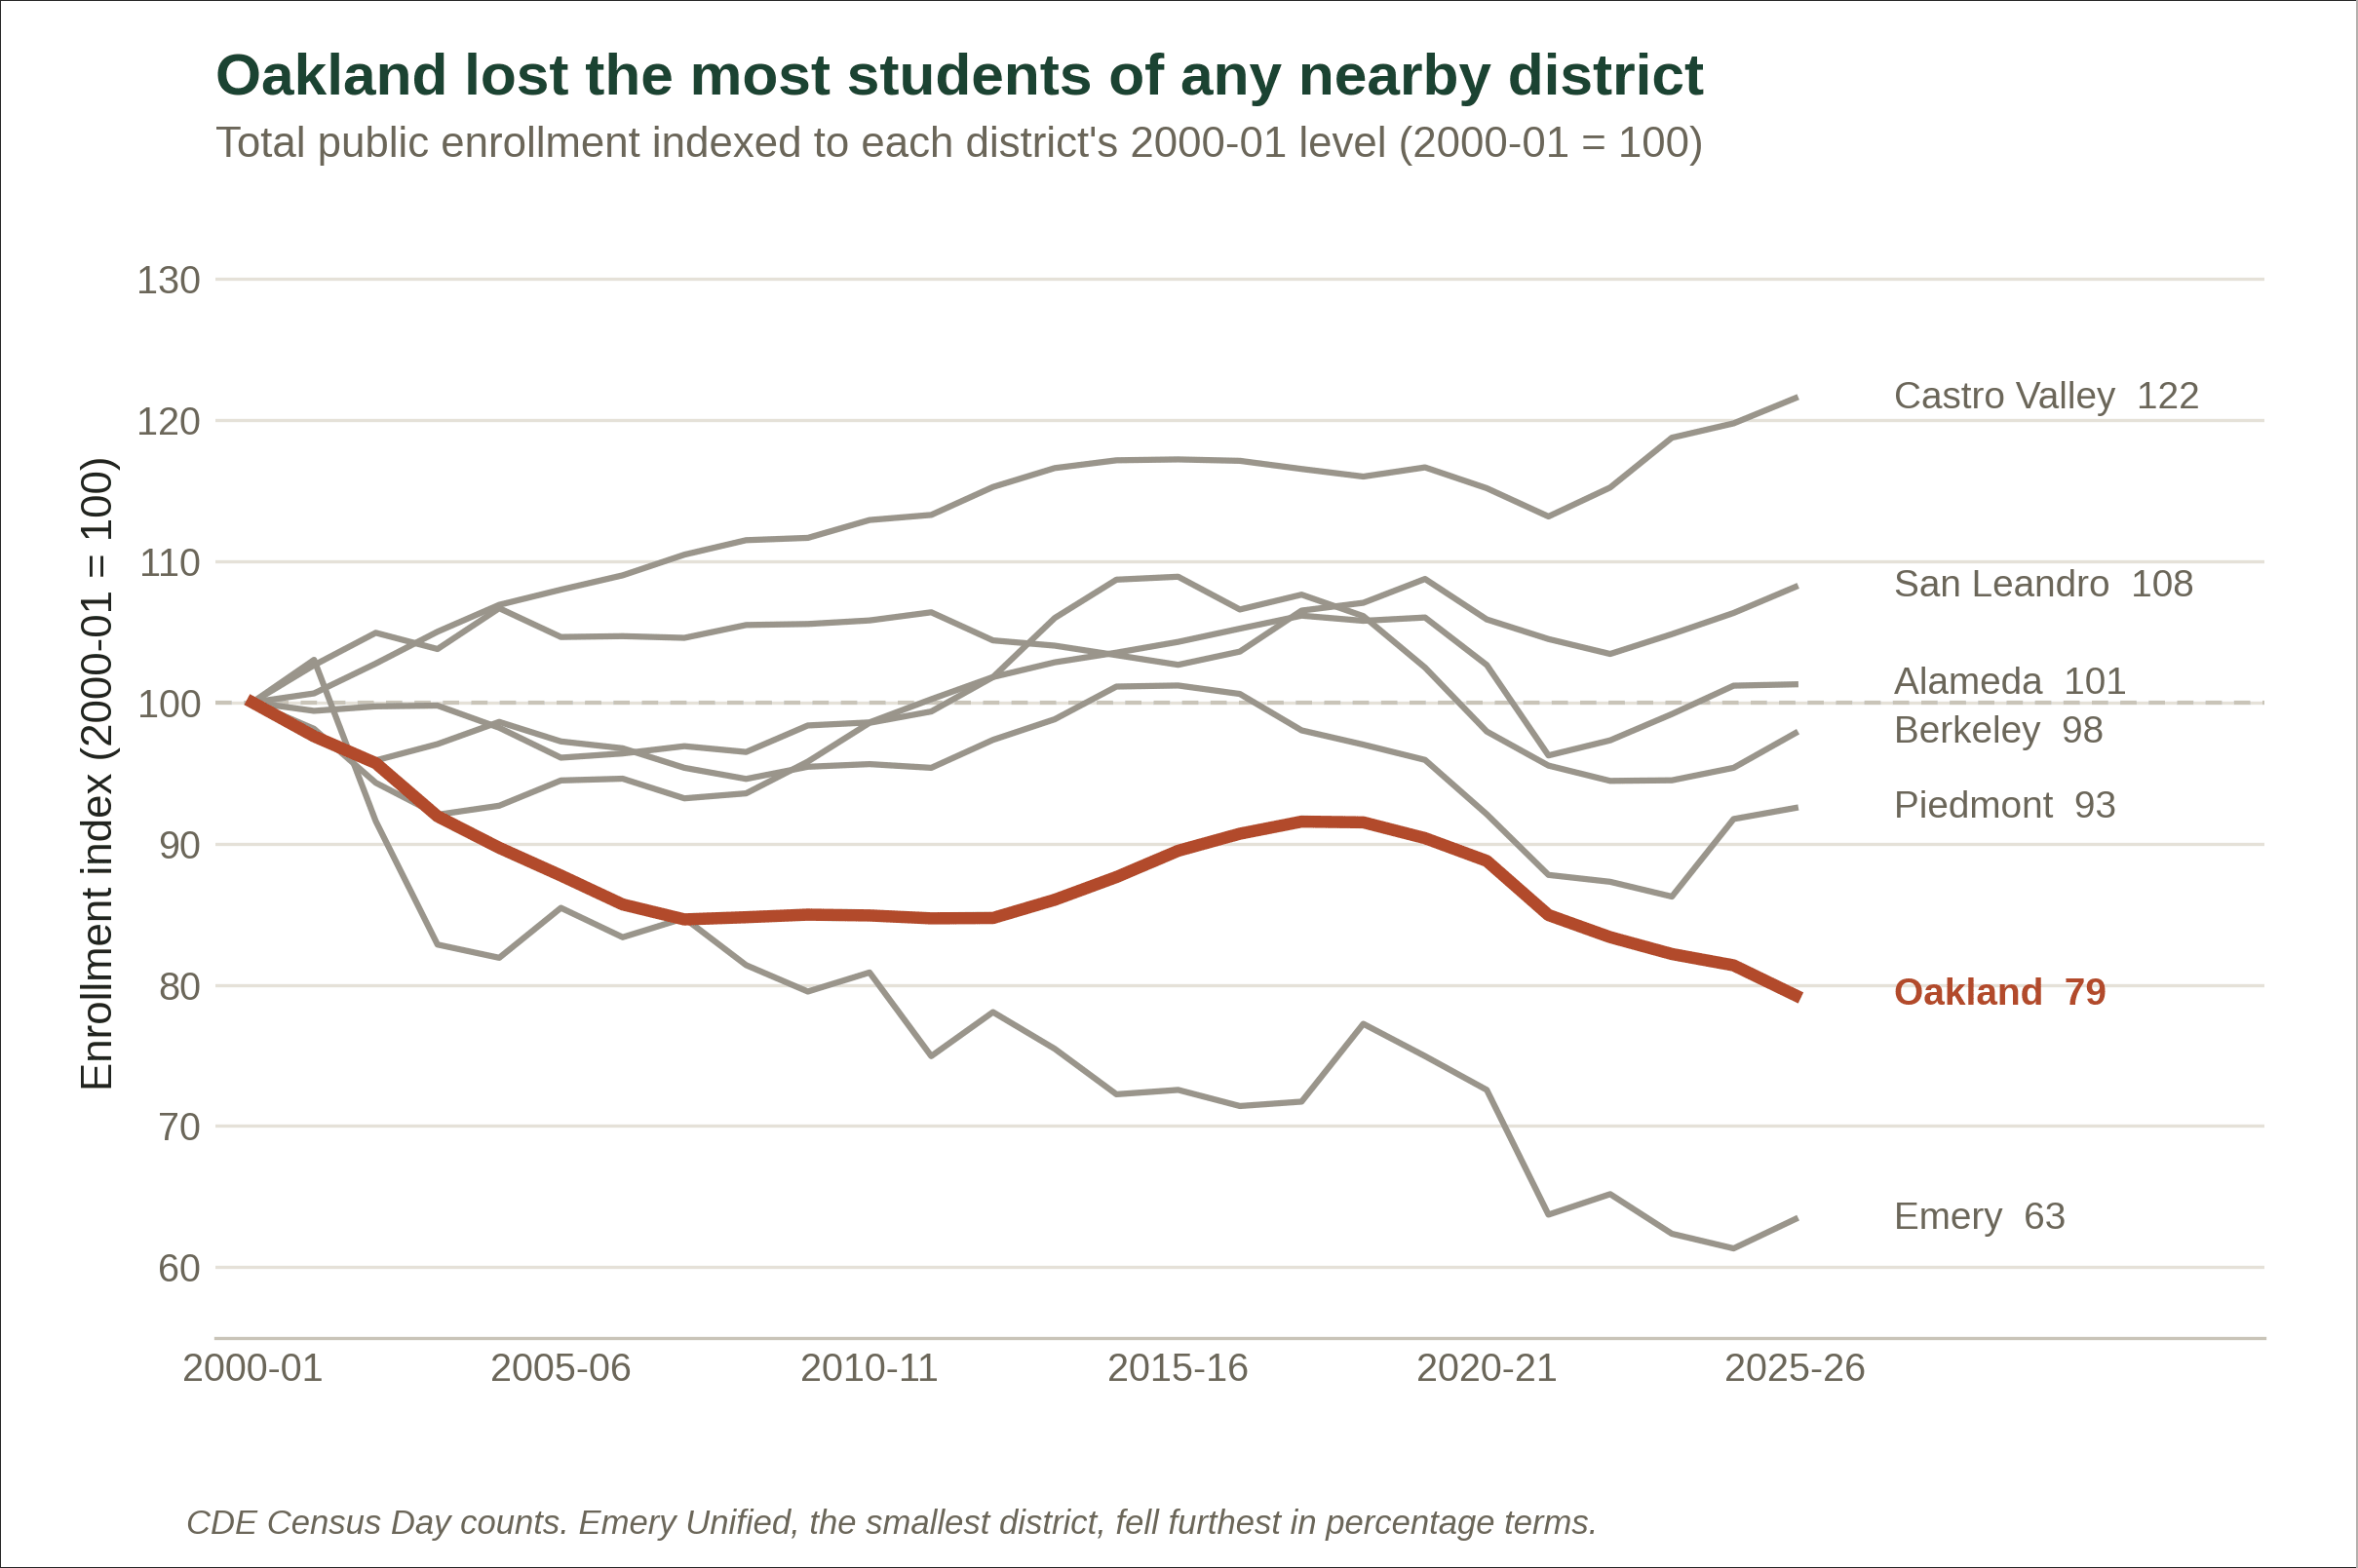
Piedmont fell 7.5% and Berkeley 2.2%.
Alameda (+1.3%), San Leandro (+8.2%) and Castro Valley (+22%) ended above their 2000-01 levels.
One in five school-age Oaklanders is outside local public schools
To see how many school-age children are not in their district’s public schools, we compared each district’s Census population estimate with its average public enrollment for the same years — the difference is the gap.
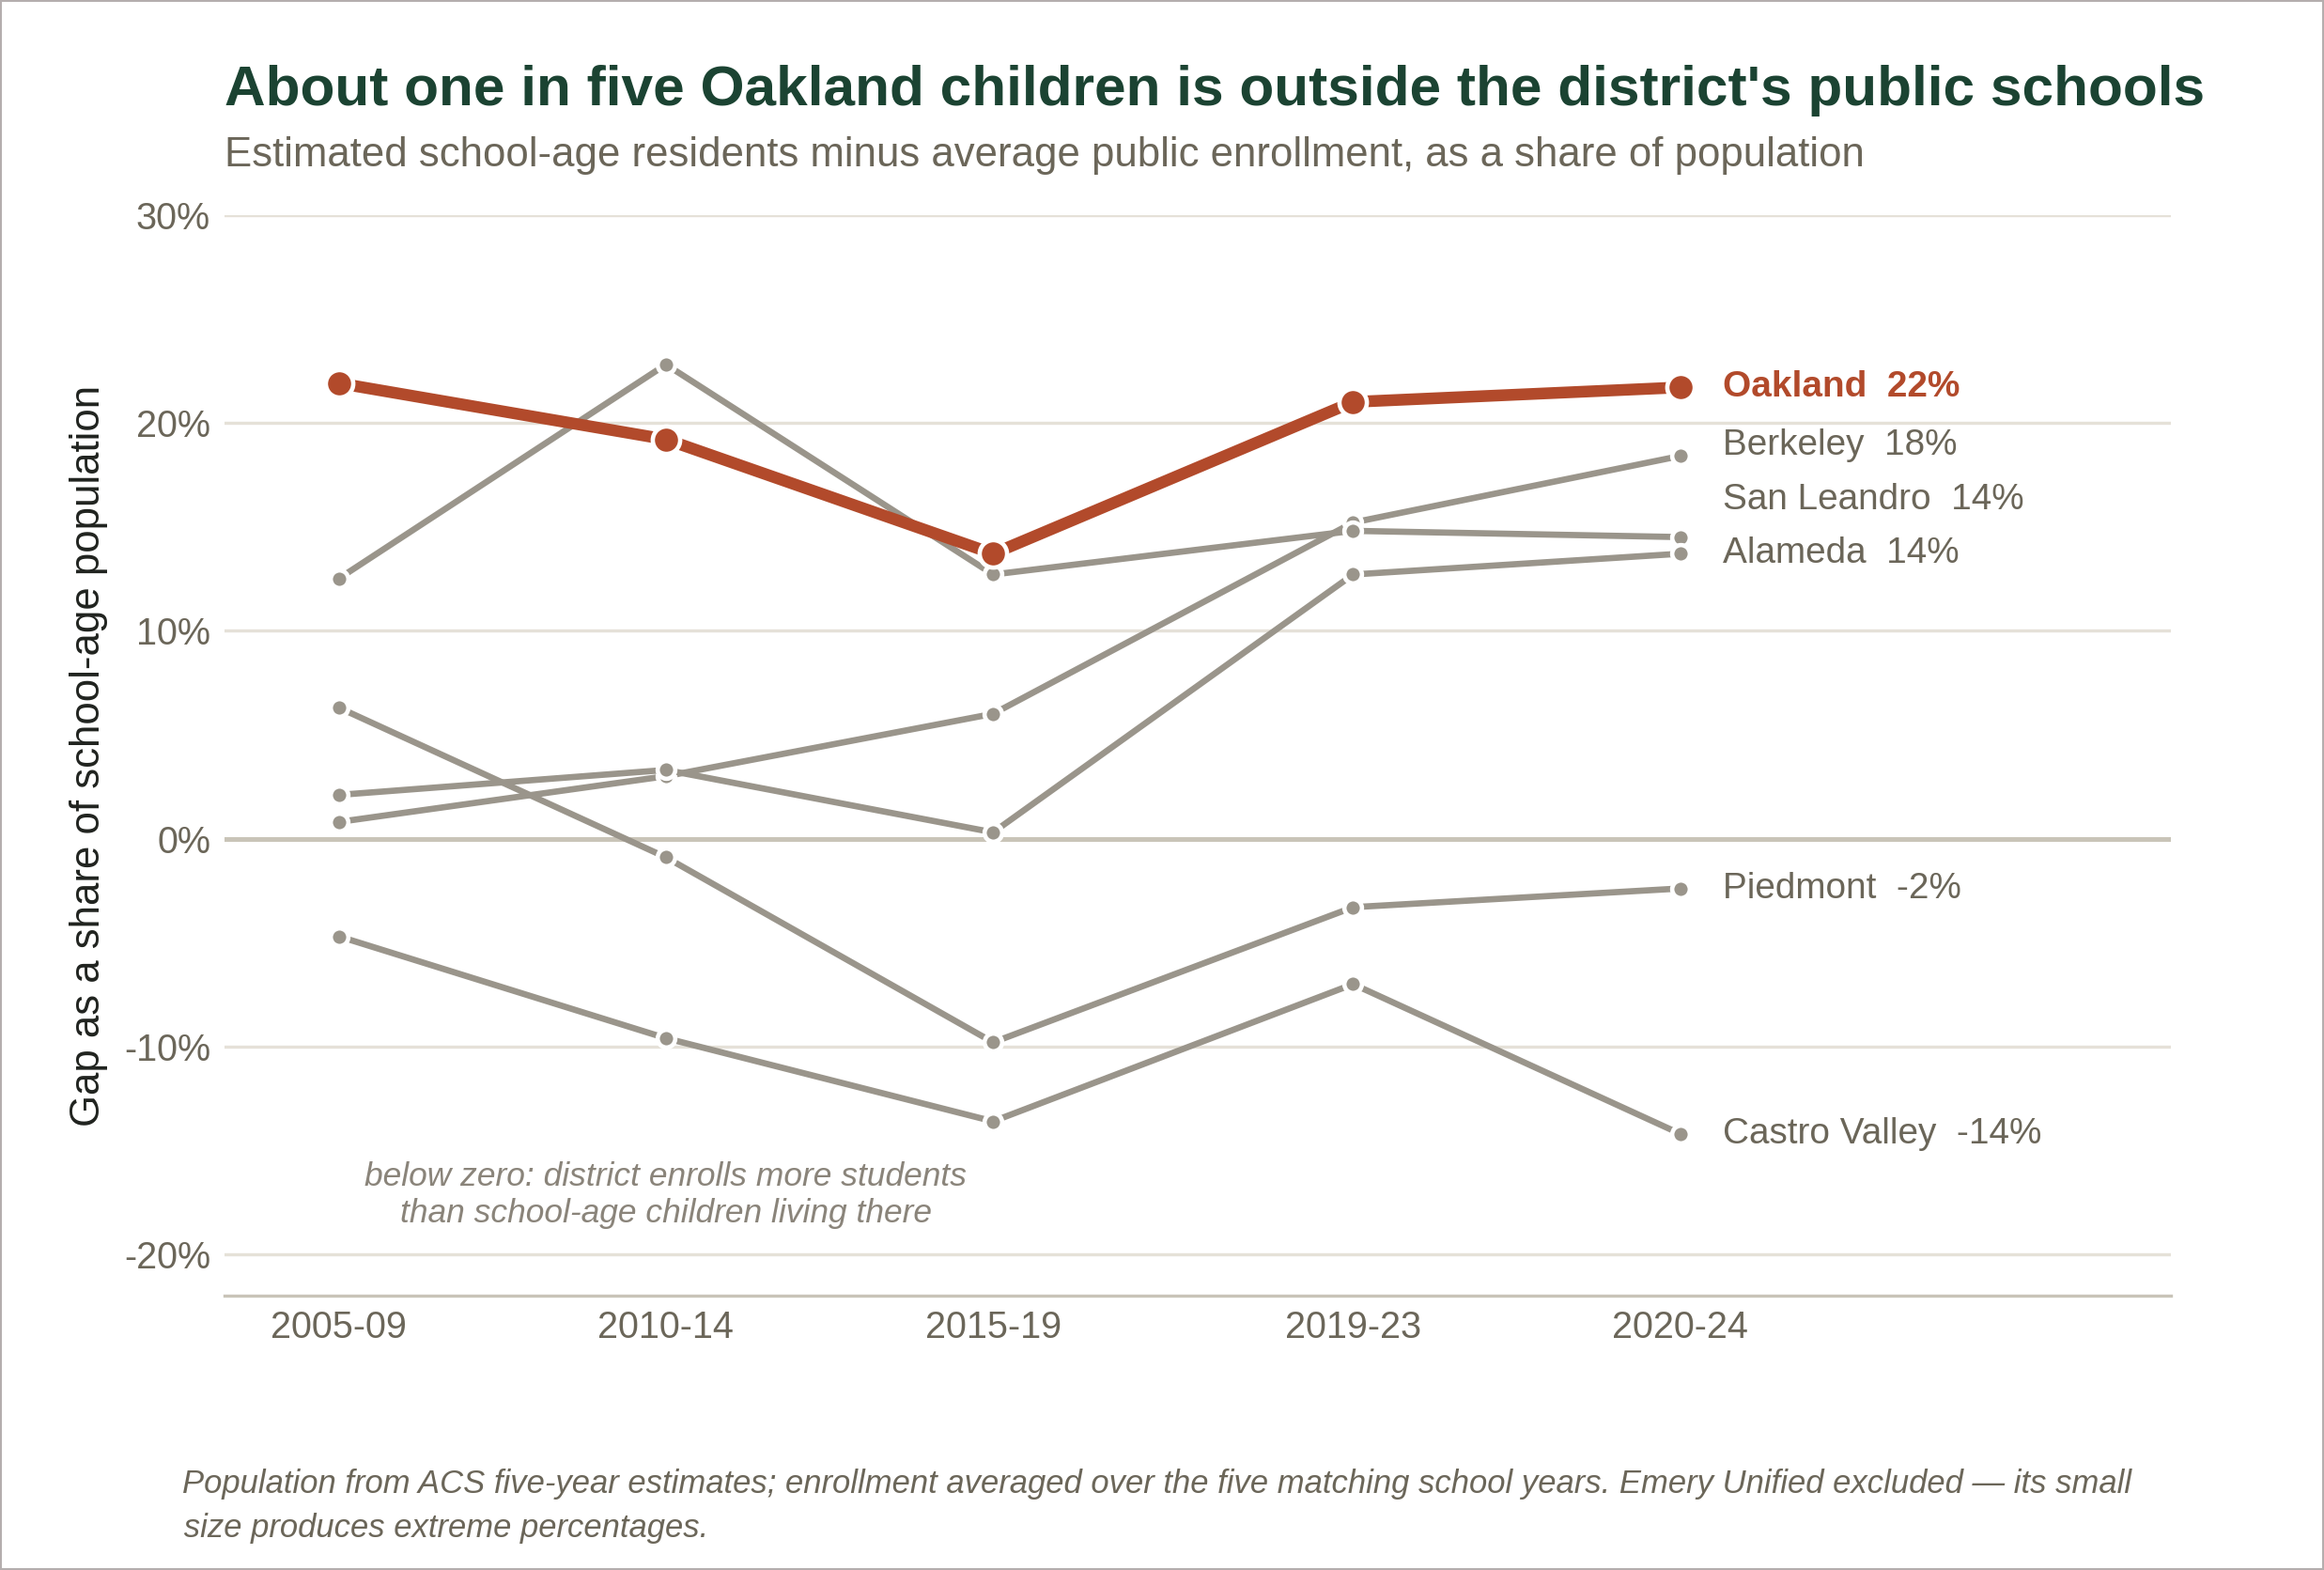
Oakland’s gap was the largest in every period measured: 14% to 22% of its school-age population.
A large gap fits with more children in private schools, homeschooling, other districts, or not enrolled at all.
But this is a net estimate, not a head count: OUSD also enrolls students from outside its boundaries, which shrinks the gap. A few districts enroll more students than the estimated children living there.
These are survey-based estimates whose ranges cover only survey error; read them as broad indicators.
If you like our work, please consider becoming a supporting member. Your donation in any amount helps us continue to produce articles like this one.
Other considerations and counterpoints
Points for readers to consider, largely without rebuttal:
In percentage terms, much smaller Emery declined more than OUSD (37% versus 21%).
OUSD enrollment grew 4.6% in the 2010s while Berkeley, Piedmont and Emery declined.
The population and enrollment series end in different years and use different methods, so headline percentages are not perfectly synchronized.
The gap estimate’s ranges overlap with several neighbors’, and nonresident enrollment would shrink Oakland’s gap.
Part of the district-run decline is classification, not departure: converted schools count as charters throughout (see methodology notes).
Charter schools are public schools too: charter growth stays within Oakland’s public system, so the district-run decline does not mean those students left public education.
Additional methodology notes are presented in the endnotes.10
A compounding loss
Oakland’s school-age population fell sharply in the 2000s, partly rebounded by 2020, and appears to be falling again — an estimated 23% below its 2000 benchmark.
Total enrollment followed a similar arc, ending 21% down — now roughly comparable to the population’s decline.
The sharpest split is within the total: district-run enrollment fell 35% — far beyond both the total decline and the population decline — while charter enrollment grew more than twelvefold before peaking in 2019-20.
The comprehensive reading: Oakland’s district-run schools lost more than a third of their students to three forces — a shrinking school-age population, a net shift of children out of local public schools, and a shift within public enrollment toward charters.
What the data does not explain is why any family left, or where each student went.
Read these related articles:


ABOUT THE AUTHOR
Emmet Gardner is a student-leader at Bishop O’Dowd High School with a strong focus on youth STEM education and peer mentorship. Over the past three years, he has worked closely with Kids Teach Tech, an organization dedicated to providing technology and engineering education to underserved youth, and is a teacher at their UC Berkeley Programming Summer Camps. Emmet is a participant in Oakland Report’s inaugural summer internship program.

WE ARE 100% SUPPORTED BY YOU
Oakland Report is an experiment in a new form of media. Our mission is to provide accurate, deep-dive, data-driven reporting and analysis that you will find nowhere else. If you value our work, please donate. All contributions go directly to sustaining and growing our 501(c)(3) nonprofit work.
Editors’ note: The original version of this article displayed Figure 2 with population figures only through the year 2020. The figure has been updated to also include population estimates from 2024 to align with the article narrative. Our thanks to an alert reader for bringing the missing data to our attention.
Bay City News contributors. "Oakland Unified school board approves school closures, mergers amid public outcry." NBC Bay Area, Feb. 9, 2022. https://www.nbcbayarea.com/news/local/oakland-unified-school-board-approves-school-closures-mergers-amid-public-outcry/2805922/
Rasmus, Allie. “Oakland Unified warns of possible school closures, budget cuts.” KTVU, Oct. 31, 2024. https://www.ktvu.com/news/oakland-unified-school-district-warns-budget-cuts-possible-school-closures
California Department of Education. “Census Day enrollment data, 2000-01 through 2025-26.” CDE downloadable data files, accessed Jul. 19, 2026. https://www.cde.ca.gov/ds/ad/filesenr.asp
U.S. Census Bureau and National Center for Education Statistics. “Decennial census school-district tabulations, 2000 (2001-02 district boundaries), 2010 and 2020.” Accessed Jul. 19, 2026. https://data.census.gov/
U.S. Census Bureau. “American Community Survey five-year estimates, detailed table B01001 (age and sex), school-district geographies, 2005-09 through 2020-24.” Accessed Jul. 19-20, 2026. https://data.census.gov/table?q=B01001
Lafortune, Julien and Emmanuel Prunty. "Factors and Future Projections for K–12 declining enrollment." Public Policy Institute of California, December 2023. https://www.ppic.org/publication/factors-and-future-projections-for-k-12-declining-enrollment/
County of Los Angeles Department of Public Health, Family Health Outcomes Project. “Live Births 2000,” citing California Department of Health Services, Center for Health Statistics, Vital Statistics. Accessed Jul. 20, 2026. http://publichealth.lacounty.gov/mch/fhop/fhop00/Sections/sect1_lb.pdf
U.S. Census Bureau. “American Community Survey one-year estimates, detailed table B01001 (age and sex), Oakland Unified School District geography, 2021–2024.” Retrieved via the Census Bureau data API, Jul. 20, 2026. https://api.census.gov/
U.S. Census Bureau. Census 2000 Summary File 1, table P012, and 2020 Census Demographic and Housing Characteristics File, table P12, California. Retrieved via the Census Bureau data API, Jul. 20, 2026. https://api.census.gov/
Thank you Emmet and Oakland Report. If Oakland had good leadership and school board, this tragedic reality would not be our situation today. The education of our youth has to be a primary concern, the youth are our future. We can turn this around, Mississippi turned their failied education system, to a great one. We can do this for Oakland. Mindy Pechenuk, for Oakland Mayor 2026
What a truly sad state of affairs. A neighborhood friend (who like me, grew up here) and I were just talking yesterday about the great teachers we had at Oakland Tech (late 50s--mid 60s), people whose hard work truly helped shape our futures. We remember their names, what they looked like, how hard they made us work, how hard they worked on our behalf. A different time.