



Oakland Report continues its coverage of the Oakland Unified School District (OUSD) board as it works to close a long-term budget gap and avoid state receivership. Here we examine how much OUSD spends per student and how its students score in English and Math proficiency compared to other school districts.
OUSD compared to other school districts
Oakland Report compared Oakland Unified School District’s (OUSD’s) spending and test scores with its Bay Area neighbors and with large, high-need districts elsewhere in California.
Oakland Unified School District spent $28,286 per student in average daily attendance (ADA) in the 2024–25 school year — 31% above the statewide average for unified districts and the 41st-highest figure among California's 345 unified districts.1
Among the 62 unified districts serving more than 15,000 students in ADA, only Los Angeles Unified and Newport-Mesa Unified spent more.2
Key findings
OUSD is a high-spending district by any comparison. Its $28,286 per ADA exceeds the statewide unified average of $21,578 by $6,708 per student, and exceeds Fremont Unified's $16,597 by more than $11,000.
The district that spends nearly as much as Oakland scores near the top of the state. Berkeley Unified, the second-highest per-pupil spender in this comparison, posted 72% proficiency in English and 66% in math.
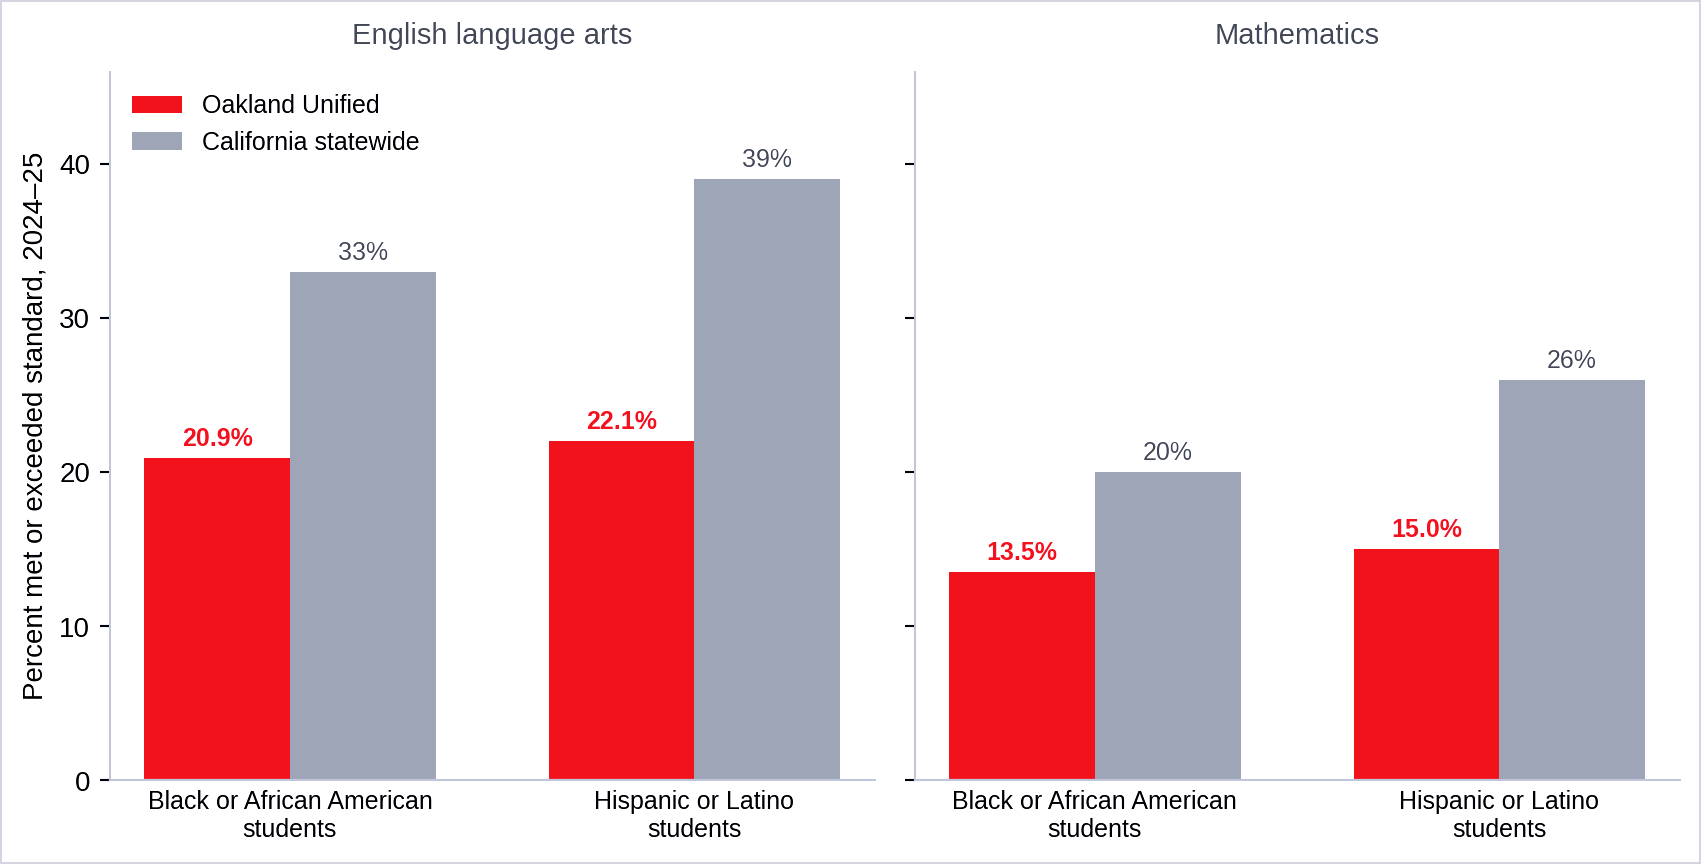
OUSD’s largest student groups lag by roughly 12 to 17 percentage points. Oakland’s Black students met the English standard at 21%, compared to 33% for Black students statewide; Oakland’s Hispanic students at 22%, compared to 39% statewide.
Oakland’s overall test scores are below the state average, but not below comparable large, high-need districts. In 2024–25, only 34% of OUSD students met or exceeded the state standard in English language arts and only 27% did so in mathematics, against statewide figures of 49% and 37%. However, among the large, high-need districts we examined, Oakland ranks second in Math and mid-pack in English.
The 2024–25 fiscal gap is not purely a governance issue. The final federal pandemic-relief dollars had to be obligated by Sept. 30, 2024, with liquidation running into January 2025 — squarely within the fiscal year under examination. Deficit spending was widespread among school districts that year.
Subscribe for free to Oakland Report.
OUSD spent the most per student of any nearby district
Oakland Unified spent the most per student among nearby Bay Area school districts including Alameda, Berkeley, Fremont, Hayward, Piedmont, and Richmond (West Contra Costa Unified).3
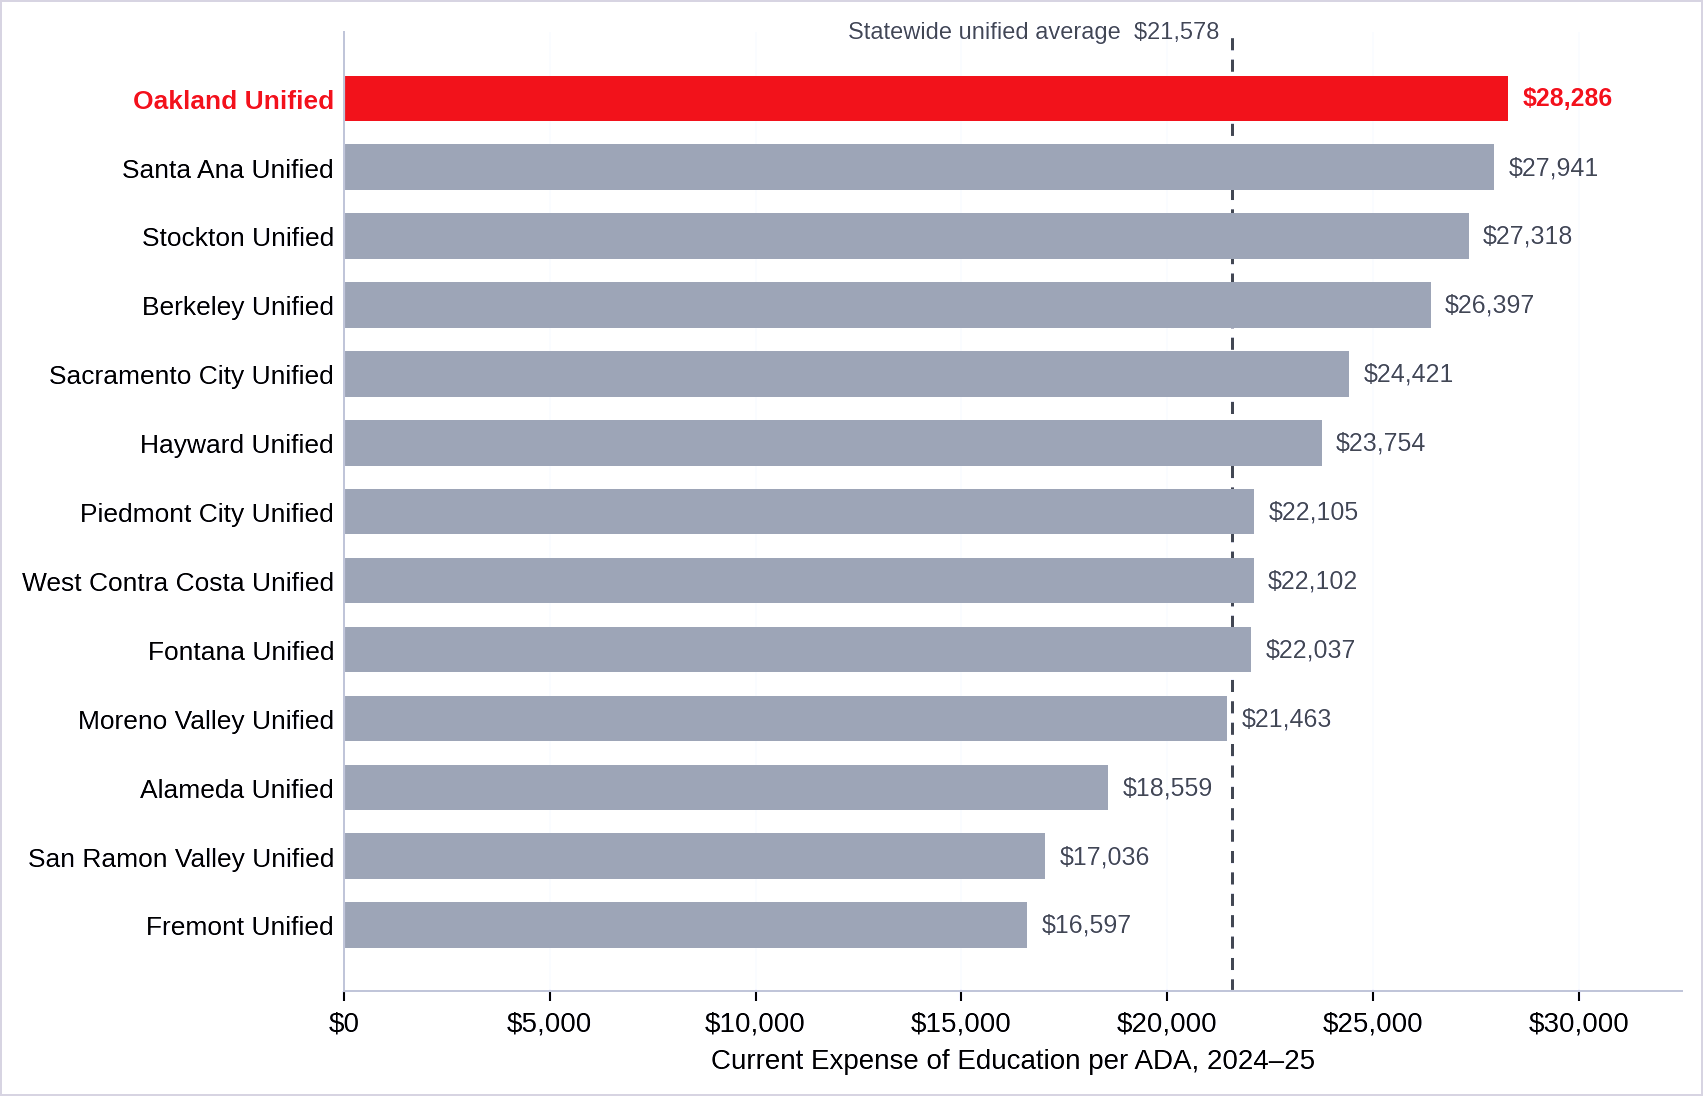
OUSD sat at the top of the local spending scale — and well above the state average — with expenditures of $28,286 per student in average daily attendance (ADA).
Berkeley, Oakland’s smaller neighbor, wasn’t far behind proportionally, spending $26,397 per student.
Hayward spent $23,754 per student; San Leandro spent $21,588 per student; and Richmond (West Contra Costa Unified) spent $22,102 per student.
Alameda ($18,559) and Fremont ($15,656) spent considerably less per student.
Oakland isn’t an underfunded district on a per-pupil basis, nor does its funding relative to its neighbors explain its disparity in its students’ academic proficiency.
Oakland Report has previously reported that Oakland Unified spends more per student than it takes in and is at risk of again losing local control of its budget to the state.45
Among comparable large, high-need districts, Oakland’s academic results are mid-pack — not last
Oakland’s proficiency rates are far below the state average: 34% in English compared to 49% statewide, and 27% in Math compared to 37% statewide.67
But the comparable large, high need districts that spend far less than Oakland do not, as a group, outperform it.
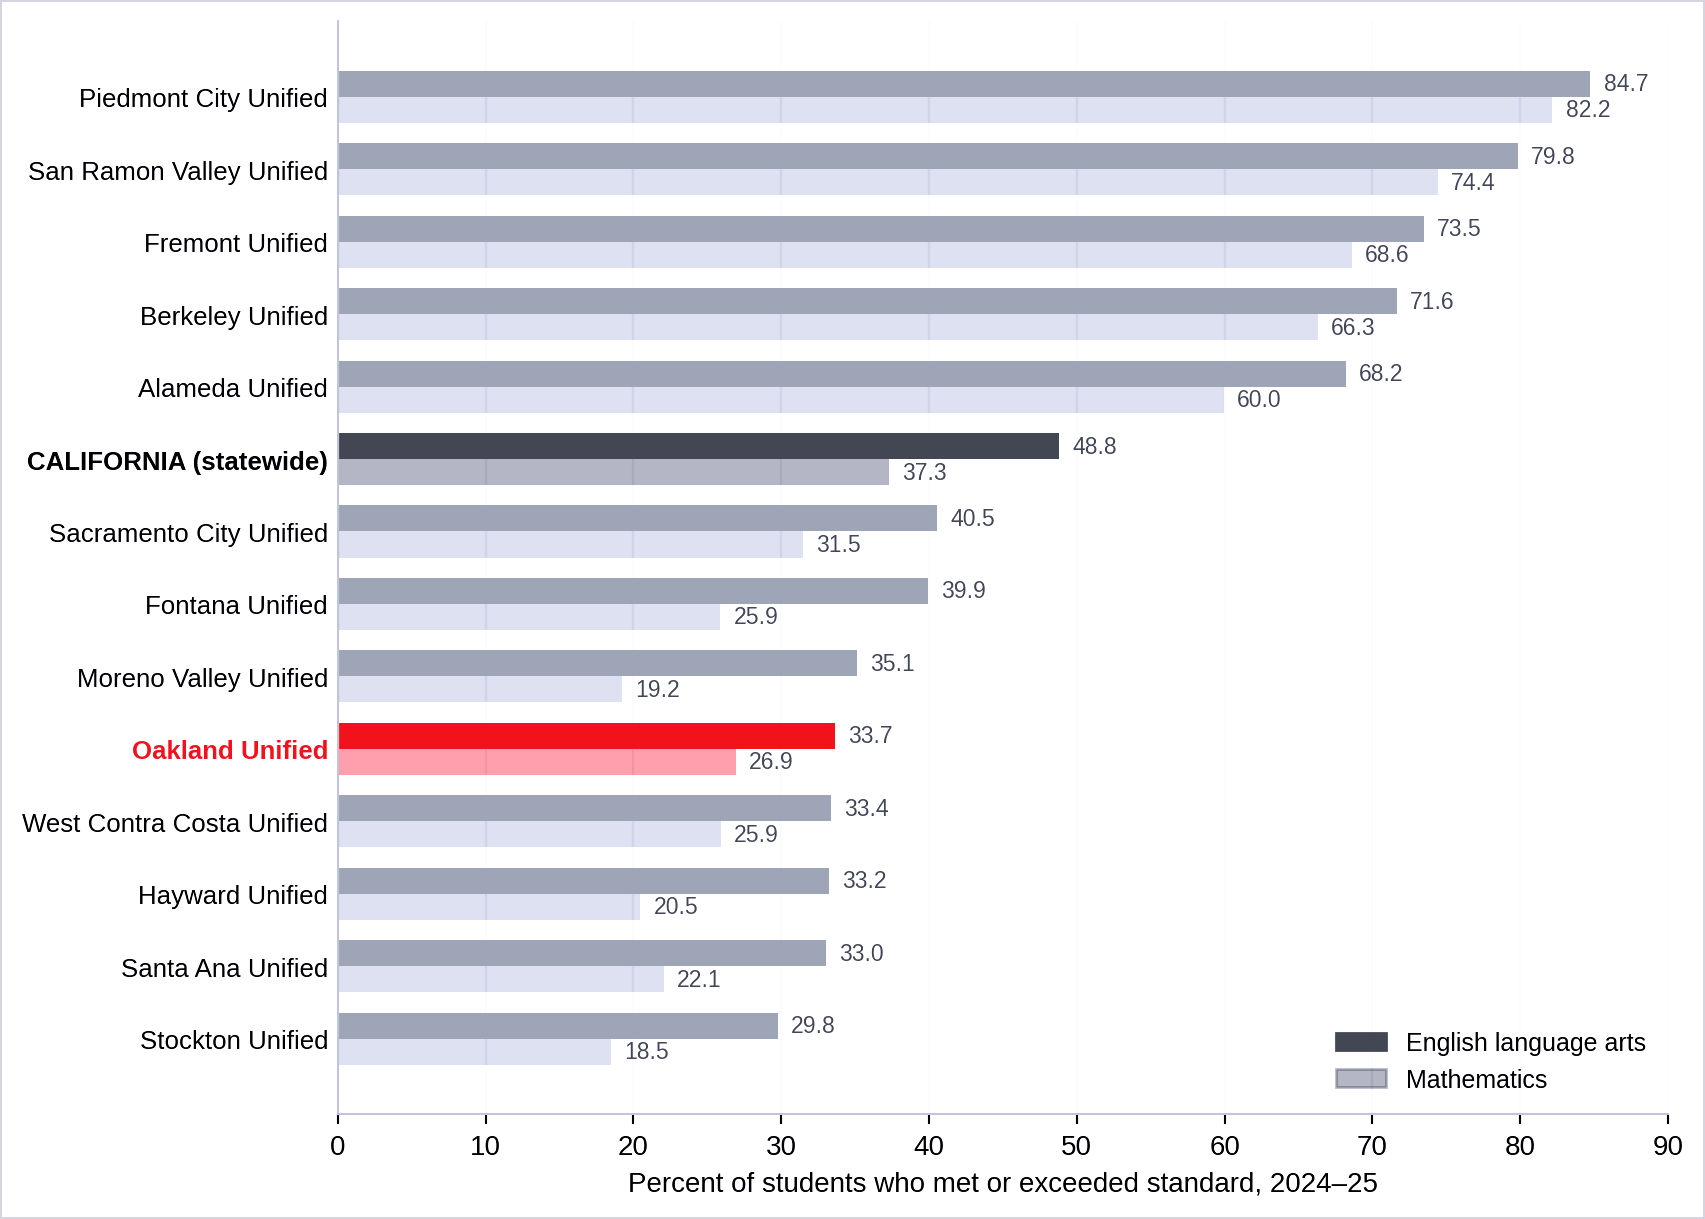
Fontana Unified, Moreno Valley Unified, and Stockton Unified — large, high-need districts reasonably comparable to Oakland — posted Math proficiency of 26%, 19%, and 19% respectively. Santa Ana Unified posted 22%.891011
Each of these districts scored below Oakland in mathematics. These districts serve large, often under-resourced student populations, and appear to manage their finances more efficiently than several wealthier Bay Area peers — but budgeting has not produced better test results.
The same pattern holds closer to home. West Contra Costa Unified (33% English, 26% Math) and Hayward Unified (33% and 20%) sit essentially level with Oakland or below it, on smaller budgets.1213
Share this article with someone you know.
Berkeley spends nearly as much as Oakland — and scores near the top of the state
Berkeley Unified is the second-highest per-student spender in this comparison. Yet, data shows 72% of Berkeley Unified students met the English standard and 66% met the Math standard — far outperforming Oakland Unified.14
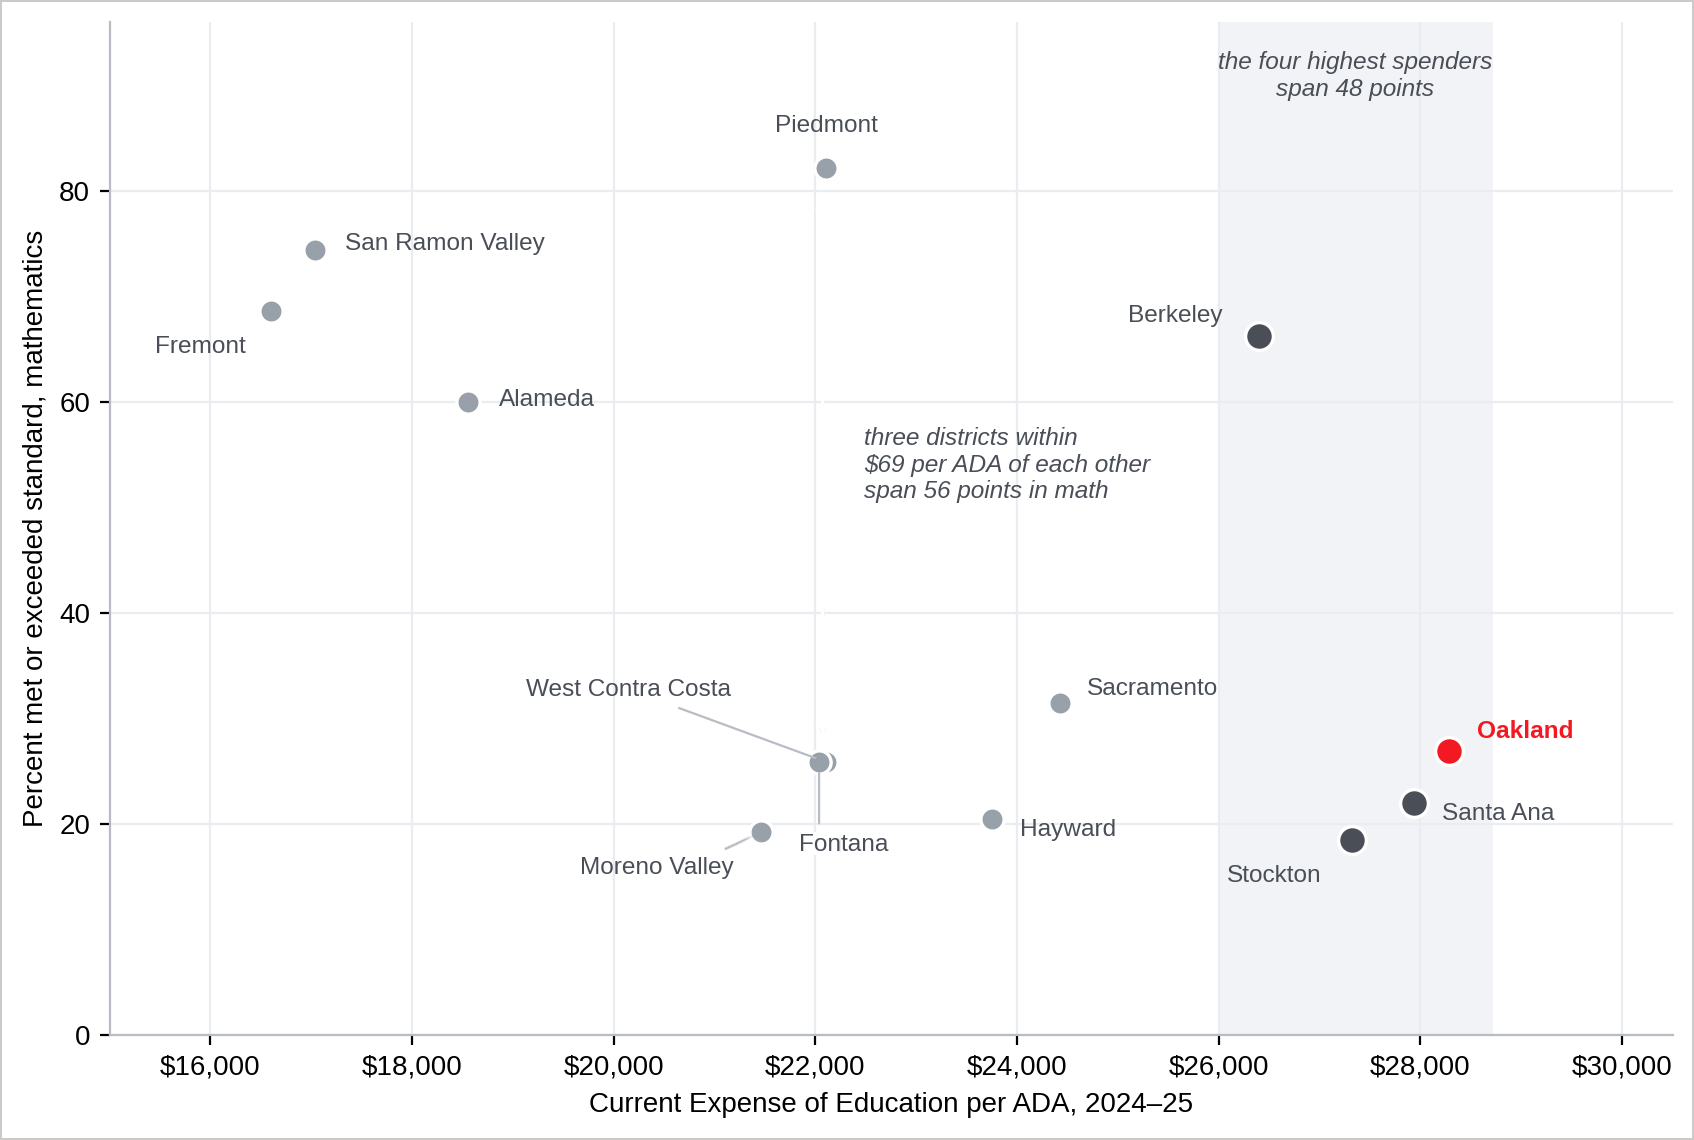
That places Berkeley within striking distance of Piedmont, San Ramon Valley and Fremont, the highest-proficiency districts in the analysis.
Berkeley and Oakland serve markedly different student populations, and the funding formula that produced their similar per-student spending is itself need-based: California’s Local Control Funding Formula pays districts supplemental and concentration grants for low-income students, English learners, and foster youth.
Districts with the highest concentrations of student need receive the most money per student and face the steepest academic headwinds. A raw comparison of dollars against scores runs those two effects together and doesn’t necessarily constitute a finding about management.
Oakland’s largest student groups lag their statewide counterparts
Statewide in 2024–25, 33% of Black students and 39% of Hispanic students met or exceeded the English standard, and 20% and 26% met the math standard, respectively.15
In Oakland, the same groups posted only 21% and 22% in English, and only 14% and 15% in math, respectively.
This aspect of Oakland Unified underperformance does not dissolve when demographics are accounted for.
Within Oakland, family income tracks outcomes more closely than any district-level comparison.
The largest single divide in economic advantage is not between Oakland and any other district. It is inside Oakland.
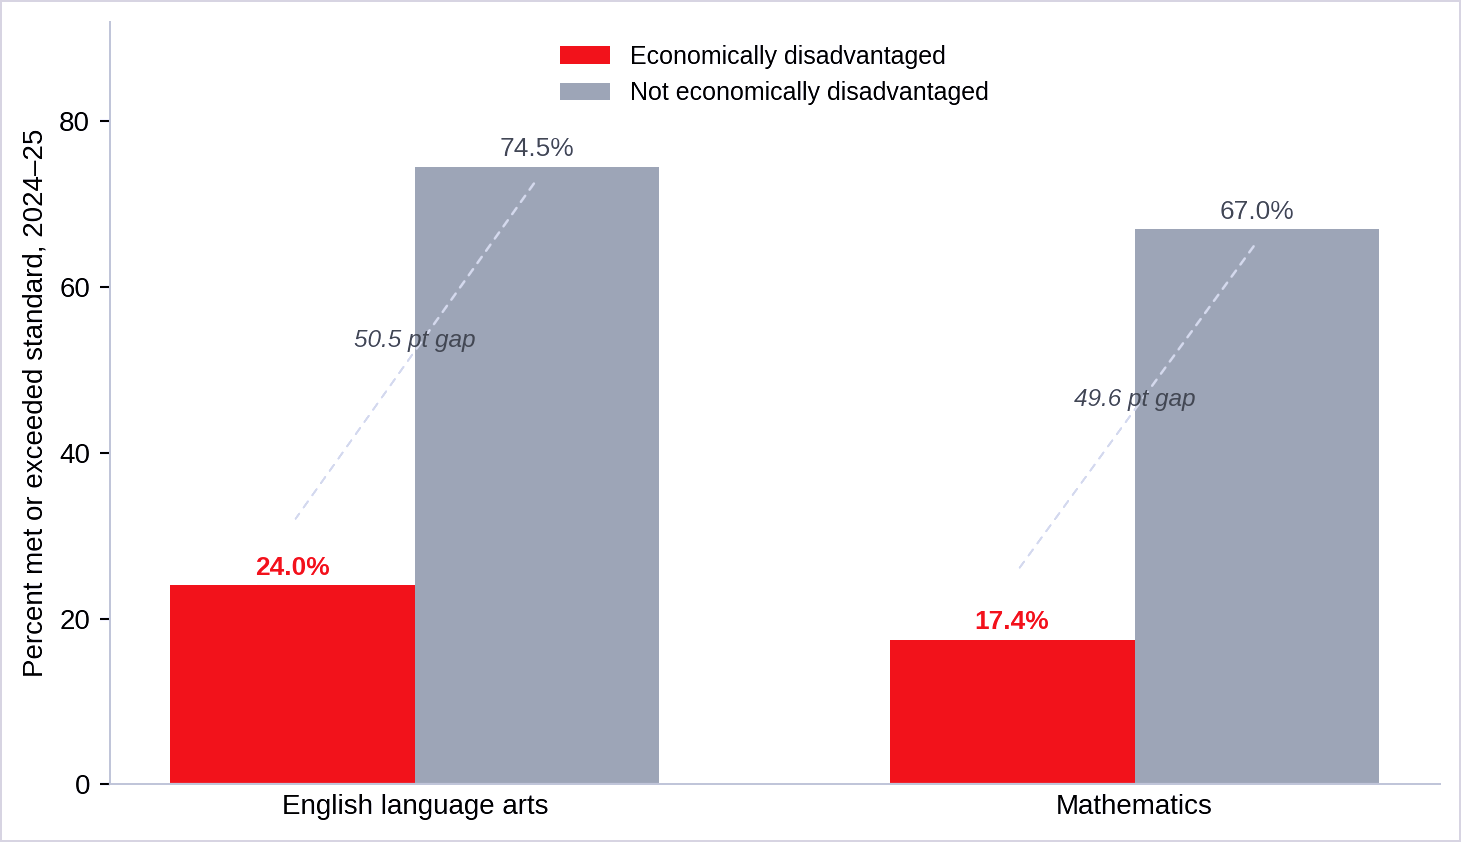
Economically disadvantaged OUSD students met the English standard at 24% and the Math standard at 17%; their non-disadvantaged classmates, at 75% and 67%, respectively.
Both groups attend the same district, under the same board, the same budget, and the same central administration — and yet, there exists a fifty-point gap in performance between two groups of students inside the same district.
Donate to Oakland Report. Your contribution in any amount helps us to continue to produce accurate, deep-dive, well-researched articles like this one.
Methodology
Oakland Report compared 2024–25 per-student expenditure figures for thirteen California unified school districts against those districts’ 2024–25 California Assessment of Student Performance and Progress (CAASPP) Smarter Balanced results, reported as the percentage of students who met or exceeded standard in English language arts and mathematics.
The neighboring set represents a sample of districts near Oakland. The statewide set (Fontana, Moreno Valley, Sacramento City, Santa Ana, Stockton) represents districts with comparable enrollment scale and student demographics.
Fiscal figures are expressed per student in average daily attendance (ADA), the basis on which California funds districts — not per enrolled student. The two differ, and in a district with high chronic absenteeism the per-ADA figure runs higher than the per-enrollment figure.
Test results are reported at the district level; readers should note that district-authorized charter schools report separately from district-run schools, and the fiscal and academic figures may not cover a precisely identical set of students.
Correlation is not causation
Pairing two numbers is not the same as establishing a relationship between them. This analysis pairs district-level fiscal data with district-level test results. Where the comparison holds, we say so; where it collapses under scrutiny, we say that too.
Thirteen districts is a small, but representative sample. The two variables move together only loosely, and the direction of any relationship is not established by a table. A district can spend more because its students need more.
Per-student dollars are not comparable across regions without adjustment. Roughly four-fifths of a district’s budget is compensation, and Bay Area salary costs run well above Central Valley and Inland Empire costs. In short, Oakland’s and Fontana’s spending do not buy the same quantity of teaching. This analysis makes no cost-of-living adjustment, and the raw gap therefore may overstate real differences in resources.
Declining enrollment inflates per-student spending unless a district implements cost reductions. Oakland Unified enrollment fell 12% between 2018–19 and 2024–25. Fixed costs — buildings, utilities, central administration — spread across fewer students raise the per-student figure.
This is a spending measure, not a budget-balance measure. The California Department of Education’s Current Expense of Education data show what a district spent, not whether it spent more than it collected. Oakland Report has separately reported that OUSD spends more per student than it takes in and has been operating under state fiscal scrutiny; the district held a negative budget certification for 2024–25.16 Those findings rest on the district's own budget filings, not on the figures charted here.
One year of test scores is a snapshot. Proficiency rates rose statewide in 2024–25 — 1.8 percentage points in each subject — and rose in Oakland too. A longitudinal analysis is beyond the scope of this article, and would likely reveal more than a single-year snapshot.
2024–25 was an unusual fiscal year. The final tranche of federal Elementary and Secondary School Emergency Relief funds had to be obligated by Sept. 30, 2024.17 Widespread deficit spending in that year reflects a one-time federal cliff as much as any district’s decisions, and a single year is not a basis for a comprehensive judgment about management.
Read this related article:

Other considerations and counterpoints
Presented largely without rebuttal, for readers to consider:
High-need districts genuinely cost more to run. Special education, newcomer and English-learner programs, mental health staffing, and nutrition services are real costs that a low-need district does not carry. A district serving them will spend more per student, understandably.
Oakland’s scores are improving. English proficiency rose 0.57 points and Math 1.35 points over the prior year. The gains are small, but they are gains.
Deficit spending can be deliberate. Drawing down a reserve to avoid mid-year cuts to classrooms potentially is a defensible choice, not automatically a failure — and one that a single-year revenue-versus-expenditure table cannot distinguish from a failure.
Test scores are a narrow measure. CAASPP proficiency captures two subjects at seven grade levels. Graduation rates, chronic absenteeism, college and career readiness — factors which are beyond the scope of this analysis — also are part of what a district produces.
The district’s own account. OUSD leadership has attributed enrollment decline to falling birth rates, families leaving Oakland, and competition from charter, private, and neighboring districts that accept transfers — factors that nonetheless drive the revenue side of the gap.18
Read this related article:


OUSD is not underfunded relative to its neighbors
High spending sits alongside poor outcomes for OUSD but not other districts.
For example, Berkeley is a big per-student spender while also being among the strongest performers in the state. Several of the lowest spenders run balanced books and post some of the weakest results in comparison.
OUSD is not underfunded relative to its neighbors. It spends more than it receives. And when its students are compared with demographically similar students elsewhere in California, Oakland trails by double digits in both English and Math proficiency.
The evidence indicates that OUSD suffers not from a funding gap, but more likely from the district’s priorities and decision-making.
From this conclusion, the following question perhaps is not how much funding is needed, but why the funding already in hand does not translate into either balanced budgets or better outcomes. This analysis doesn’t answer that, but establishes that the answer cannot be found in a per-student dollar figure alone.

WE ARE 100% SUPPORTED BY YOU
Oakland Report provides accurate, data-driven reporting and analysis that you will find nowhere else. If you value our work, please donate. All contributions go directly to sustaining and growing our nonprofit work:
ABOUT THE AUTHOR
Tarini Kakkar is a student journalist majoring in Cognitive Science and English at the University of California, Berkeley. She is particularly interested in community and data-driven reporting across print, audio, and video platforms.
Growing up in Delhi NCR, India instilled her appreciation for arts and culture and an attunement for political multimedia. Attending Berkeley gave her an expanded platform to engage with various student media, and she now spends much of her time juggling meetings with academics and coffee runs.
Tarini is a steadfast advocate for transparency and fairness in journalism, aiming to build a career in reporting in confident defiance of the claim that news is “a dying industry.” She is participating in Oakland Report’s inaugural summer internship program.

California Department of Education. "2024–25 Current Expense per Average Daily Attendance (ADA) — District." CDE School Fiscal Services Division, Current Expense of Education (Education Code Section 41372), as of Jan. 29, 2026. https://www.cde.ca.gov/ds/fd/ec/documents/currentexpense2425.xlsx (index page: https://www.cde.ca.gov/ds/fd/ec/currentexpense.asp)
California Department of Education contributors. “School district budgets 2024–25 — criteria and standards for fiscal solvency.” CDE Fiscal Oversight and Support Office, accessed Aug. 4, 2026. https://www.cde.ca.gov/fg/fi/ss/distbudgetcsfy2425.asp
Education Data Partnership contributors. “District financial profile — Oakland Unified.” Ed-Data, accessed Aug. 4, 2026. https://www.ed-data.org/district/Alameda/Oakland-Unified
Oakland Report contributors. “‘A decision-making problem’: County schools chief warns Oakland Unified is at risk of running out of money.” Oakland Report, Apr. 21, 2026. https://www.oaklandreport.org/p/20260421-ousd-at-risk
Kakkar, Tarini. “OUSD spent its COVID windfall — but it won’t show receipts.” Oakland Report, Jul. 15, 2026. https://www.oaklandreport.org/p/ousd-covid-funds-ada-budget
EdSource contributors. “Oakland Unified — Smarter Balanced test results, spring 2025.” EdSource, accessed Aug. 4, 2026. https://caaspp.edsource.org/sbac/oakland-unified-01612590000000
EdSource contributors. "State of California — Smarter Balanced test results, spring 2025." EdSource, accessed Aug. 4, 2026. https://caaspp.edsource.org/sbac/california-00000000000000
EdSource contributors. “Fontana Unified — Smarter Balanced test results, spring 2025.” EdSource, accessed Aug. 4, 2026. https://caaspp.edsource.org/sbac/fontana-unified-36677100000000
EdSource contributors. “Moreno Valley Unified — Smarter Balanced test results, spring 2025.” EdSource, accessed Aug. 4, 2026. https://caaspp.edsource.org/sbac/moreno-valley-unified-33671240000000
EdSource contributors. “Stockton Unified — Smarter Balanced test results, spring 2025.” EdSource, accessed Aug. 4, 2026. https://caaspp.edsource.org/sbac/stockton-unified-39686760000000
EdSource contributors. "Santa Ana Unified — Smarter Balanced test results, spring 2025." EdSource, accessed Aug. 4, 2026. https://caaspp.edsource.org/sbac/santa-ana-unified-30666700000000
EdSource contributors. “West Contra Costa Unified — Smarter Balanced test results, spring 2025.” EdSource, accessed Aug. 4, 2026. https://caaspp.edsource.org/sbac/west-contra-costa-unified-07617960000000
EdSource contributors. “Hayward Unified — Smarter Balanced test results, spring 2025.” EdSource, accessed Aug. 4, 2026. https://caaspp.edsource.org/sbac/hayward-unified-01611920000000
EdSource contributors. “Berkeley Unified — Smarter Balanced test results, spring 2025.” EdSource, accessed Aug. 4, 2026. https://caaspp.edsource.org/sbac/berkeley-unified-01611430000000
Education Trust-West contributors. “EdTrust-West responds to release of 2025 CAASPP results.” Ed Trust–West, Oct. 9, 2025. https://west.edtrust.org/press-release/edtrust-west-responds-to-release-of-2025-caaspp-results/
California Department of Education. "First interim status report, FY 2024–25: listing of local educational agencies receiving negative and qualified certifications." CDE Fiscal Oversight and Support Office, accessed Aug. 7, 2026. https://www.cde.ca.gov/fg/fi/ir/first2425.asp
Kemp, Heather. “The end of ESSER.” California Schools magazine, Summer 2024. https://publications.csba.org/issue/summer-2024/the-end-of-esser/
Gardner, Emmet. “Oakland public school enrollment fell 35% — far more than the shrinking child population.” Oakland Report, Jul 23, 2026. https://www.oaklandreport.org/p/ousd-enrollment-decline-district-run-schools

Thanks Tarini and Oakland Report for a necessary and important discussion. First, I want to address the quality of education. We need to implement a form of the Misssissippi Miracle in education. If our dear Oakland children can not read, write and think how are they going to have a future. No child should be promoted beyond third grade until they can read at the third grade level. The system we have of passing children up the school chain produces crime, jail time, and no future for Oakland and America. Our Oakland children deserve a future and a good life. They deserve to have a family of their own. Second, the finances are a disaster. We need an outside audit and there needs to be accountablity. If we have to close some schools to turn around the situation we should. Not that I want to close schools. My passion is the children, we need to nourish their beautiful mind and soul God gave them. You cannot make up for this when they older. Every child can learn, when given the chance. Mindy Pechenuk, for Oakland Mayor. Check out my video on education.electmindy.com
We have been very happy with the folks at Lincoln Elementary. I think a big challenge facing OUSD is the declining school age population coupled with folks going to other districts. Schools will need to be combined. I had the misery of serving as the school board chair for my kids many years ago. I raised tuition quite a bit to pay the teachers a fair wage. Let’s just say I learned how to get every parent to attend a PTA meeting. Wow. I’ve been pissing people off for a long time!! Schools can be tricky to measure “success.”