

Oakland schools budgeting 101: how OUSD spends money
OUSD’s board and leadership are struggling with a nine-figure budget crisis. Here, we zoom out on how OUSD spends money relative to other comparable districts.

")
Oakland Report is covering the Oakland Unified School District (OUSD) board of education’s efforts to close an over $100 million budget deficit and avoid a slide back into state receivership. In this installment, we provide a primer on OUSD’s budget, focusing on how Oakland schools spend money.
With this primer, our goal is to support a more informed debate by providing background on how OUSD spends money. Here are four main takeaways:
OUSD spends significantly more per student than comparable districts, notably on administrative costs that include principals, vice principals, and a range of staff intended to support teachers and students; as well as on facilities and operating maintenance expenses.
Oakland spends more per student than it takes in. OUSD’s over $100 million deficit is in the general fund, and specifically in the funds allocated by the state through the local control funding formula. While more effective use of restricted funds could help free up some of those general fund dollars for other uses, the fundamental structural issue is that the district’s expenses exceed its base allocation from the state.
Oakland has a higher-than-average number of schools relative to the size of its student population. The high number of school sites is a major structural factor driving OUSD’s spending into a deficit position. While there are some smaller potential savings possible through operational improvements, reducing the reliance on external consultants and improving facility management, structural deficits require structural adjustments at a commensurate scale in order to be resolved.
Balancing OUSD’s budget will require the board and leadership to set a clear strategic direction and reckon with these structural factors. The board’s October 8 resolutions directed staff away from school site spending cuts and prohibited the consideration of school closures or mergers. As a result of this major limitation, the budget scenarios presented at the November 19 board meeting cut less than $22 million in costs — far short of the reduction target. (After a multi-hour budget deliberation, the board passed a resolution asking the budget staff to come back in December with a revised plan to cut $100 million in costs – this time without the prior restrictions.)
Now, we’ll dive into the details.

Where OUSD spends money
OUSD’s expenditures are accounted for in two main ways in its operating budget:
Objects break expenses into accounting categories, such as salaries, supplies, or capital expenditures.
Activities correspond to accounting-defined actions OUSD must perform as part of educating students and running the district. Under the hood, activity codes ultimately are mapped back to object codes.
The 2023-2024 school year is the most recent year for which granular budget detail is publicly available.1 While slightly dated, we reference this year rather than using incomplete information for more recent school years.
Keep in mind that both “objects” and “activities” are defined by OUSD budget staff. While you can click through to get a more detailed understanding of what is included under each code, these categories are necessarily a degree removed from the detailed operations of the district.
Here, you can see OUSD’s 2023-2024 expenses broken out by object:
")
And here, you can see the same 2023-2024 expenses broken out by activity:
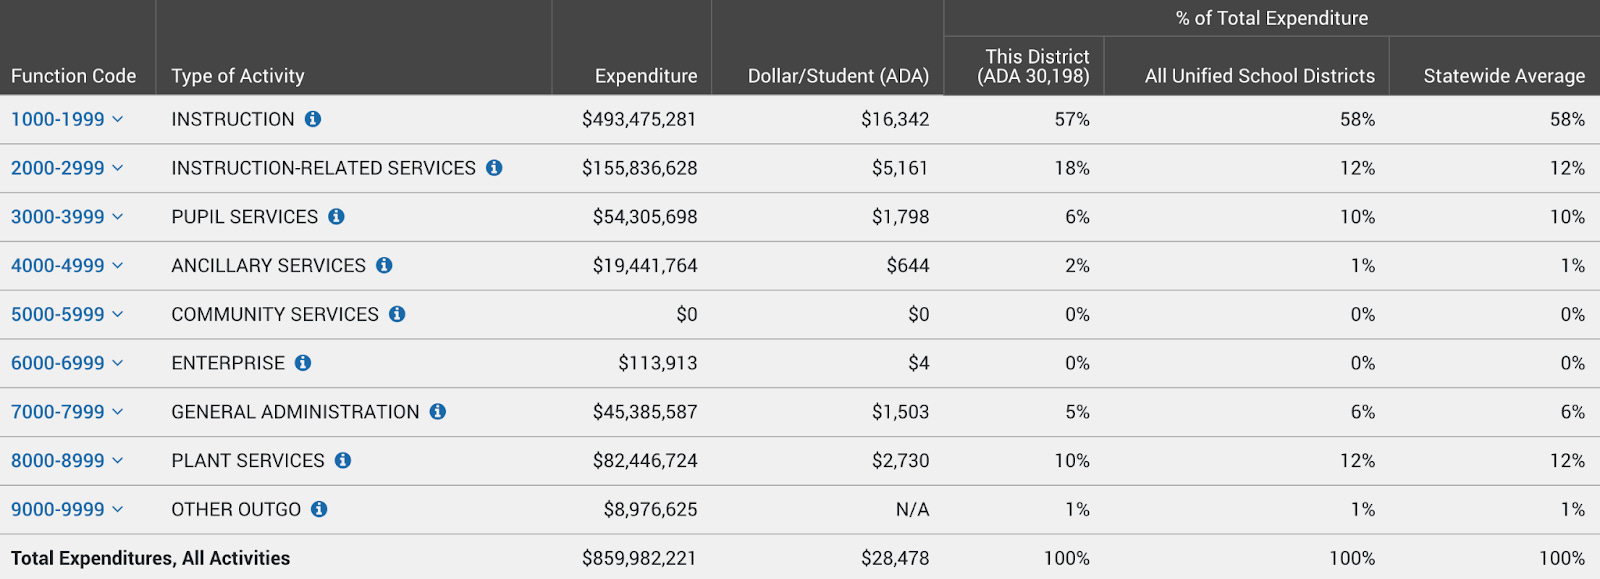
Student instruction takes up the majority of expenses
The majority (57%) of OUSD’s general fund expenditures are for student instruction, which is consistent with those of other California unified school districts that span kindergarten through high school (K-12). Instruction costs include regular classroom teachers as well as special education expenses ranging from specialized instructors to separate classrooms. In OUSD, special education expenses account for nearly $140 million and approximately 28% of its overall instruction costs.
OUSD spends more than other districts in multiple areas
A review of OUSD’s spending in 2023-24 shows that it spent significantly more per student than the state average in several areas.
OUSD’s higher per-student spending compared to other unified school districts is mostly related to school site expenses.
While Oakland might have unique circumstances that justify individual deviations from state averages, in the context of a budget crisis, these deviations can help to identify spending areas that warrant closer scrutiny:
Services and other operating expenditures — 204% of the state average. Within this category, Oakland spends more than the state average on:
Professional and consulting services — 304% of the state average, or $2,731 more per student.
Rentals, leases, repairs and non-capitalized improvements — 190% / $152 more per student.
Operations and housekeeping services — 131% / $117 more per student.
All together, this category accounts for $3,075 of additional spending per student compared to the average of all other unified school districts in California, and approximately 43% of the overall difference between OUSD’s spending and the state average.
Classified personnel salaries — 150% of state average. Broadly, this category includes staff that do not have or need professional certificates for their roles. This encompasses administrators and supervisors, as well as clerical and office staff, athletic staff, and maintenance workers. Within the category, there are two major drivers of the higher-than average expenses:
Supervisor and administrator salaries — 592% of the state average, or $1,282 more per student.
Support salaries, which include media and library staff, as well as transportation, food service, operations and maintenance — 145% / $469 more per student.
Overall, this category accounts for $1,751 of above-average spending per student and approximately 22% of the difference between OUSD’s spending and the state average.
Instruction-related services — 202% of the state average. This category includes activities that support classroom instruction, but are not instruction itself. This includes:
Principals and vice principals
Curriculum development
Teacher training
Library and media services.
Altogether, this category accounts for $2,607 higher-than-average spending per student and approximately 35% of the difference between OUSD’s spending and the state average.

Oakland’s higher-than-average expenses are driven by school site expenses, not central office expenses
In a budget presentation to the board on November 19, OUSD’s chief business officer Lisa Grant-Dawson made clear that the structural deficit essentially stems from OUSD’s spending on instruction and other school site expenses exceeding the base allocation of revenue it receives from the state.2
She further emphasized that when the board rules out making cuts to school site spending, there simply is not enough spending available in other areas to cut in order to close the deficit. It simply can’t be offset with central office expenses.2
Oakland spends significantly more than other districts on principals, vice principals, teachers and other student support at school sites. It is also spending much more than other districts on site-related services and operating expenses, as well as on consultants.
Oakland does not spend more than other districts on is central office expenses, or “general administration.” Cuts to the central office won’t address OUSD’s spending problem, and could lead to unintended consequences given some of the expenses that are classified as central, such as student computers.
This matters because in relation to the 2026-2027 budget deficit, the board, led by president Jennifer Brouhard, initially directed OUSD to focus on reducing central office expenses, specifically management expenses, and not to focus on school sites.

The board has a political incentive to focus on cutting the central office because those roles and functions are the furthest removed from students, even if they are necessary to effectively operate the schools.
The board’s focus on cutting the central office also serves to direct cuts away from classroom teachers, who are politically and legally represented by a well-resourced and influential labor union that opposes cuts that would affect its members.
In other words, the board has avoided reckoning with the areas of highest cost, which will force hard decisions about resources and spending at school sites themselves.
OUSD’s high costs are driven by two major factors – only one of which is controllable
OUSD’s budget crisis is structural in nature. We’ll focus here on structural explanations because there’s no way to address a structural deficit without addressing its structural drivers.
While short-term improvements to operating discipline are needed, they alone are not sufficient – for example, cutting central office expenses might help reduce next year’s gap, but it won’t address the underlying problem in a sustainable way.
OUSD’s high costs are driven by two major structural issues: its high concentration of high-needs students, and its high number of school sites relative to the size of its student population.
OUSD has a greater concentration of high-need students
Under California’s local control funding formula (LCFF), which is used to allocate funding to school districts across the state, OUSD has one of the greatest concentrations of high-need students in the state (82% as of 2023-2024). This includes low income students, English learners, foster children and homeless children.
")
These students require additional instructional and support services, including counselors, social workers, psychologists, family liaisons, literacy coaches and intervention teachers. While the LCFF allocates more state funding for high-need students and additional restricted funds are available, this funding is inadequate to cover all the associated costs.
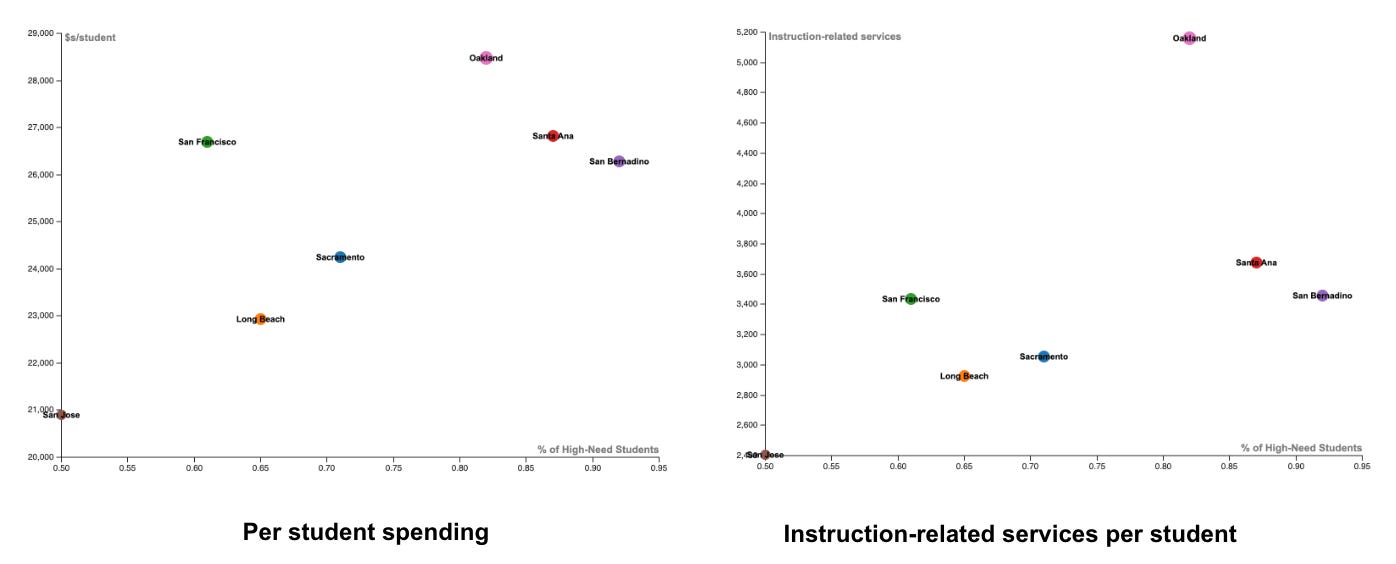
When it comes to per-student spending (and, specifically, instruction-related services per student), OUSD is an outlier among comparable districts, spending $3,281 more per student overall, 52% of which is attributable to incremental spending on instruction-related services:
Increased spending is not necessarily leading to better outcomes
It is not clear that OUSD’s increased spending is leading to better student outcomes. Oakland is performing slightly better than other large, high-needs districts on Math (26% proficiency in Oakland compared to 21% in San Bernardino and Santa Ana), but it is in line with those districts on English (33% proficiency in Oakland, the same as San Bernardino and slightly better than Santa Ana’s 31%).
While public schools struggle to bring students up to proficiency generally, this problem is especially acute in districts with significant concentrations of high-need students.
Graphing English and Math proficiency against the percentage of high-need students in the district, the correlation jumps out. The greater the percentage of high-need students, the lower the proficiency scores:
")
To be clear, the fact that the public school system so frequently fails to bring students — especially high-need students — up to basic proficiency might indicate that more state and federal funding is needed to close the gap. Yet OUSD is not in a position to change state or federal policy. It has to operate with the same constraints as other districts.
In short: Oakland’s large high-need student population is a major driver of its higher spending, but Oakland is spending significantly more per student than comparable cities with large high-need student populations. Its higher-than-average spending in this area appears not to be producing materially better outcomes.
OUSD’s high number of school sites compared to the number of students it serves
This brings us to the most hotly contested topic, which is whether Oakland has more school sites than it needs or can afford. Each individual school has fixed costs that require a certain minimum level of spending in order to safely operate. This includes on-site administrative and support staff, as well as operational and facilities management.
Looking at the same comparison set, we find that Oakland has many more schools than its peers given the size of its student population:
")
In the 2023-2024 school year, Oakland had only 373 students per school, 176 fewer students than the average across this cohort, which includes other large, urban, high-needs districts.
Here, you can see how many schools in Oakland operate with fewer than 300 students, categorized by school type:3

Closing or merging schools is politically challenging and unpopular. After a previous school board voted to close five school sites in order to achieve cost savings, the current school board reversed the decisions.4 The current board on October 8 again explicitly kept school closures off the table as a potential solution for closing the structural budget deficit.
So far there has been no in-depth research or analysis from a respected neutral party on how much money could be saved with school closures and mergers with offsetting factors like decreased student enrollment and the costs to ensure smooth transitions for students. In the absence of such analysis, advocacy groups tend to dominate the conversation with the risks and concerns, for example the Oakland Education Association teachers union’s short-form white paper opposing any school site closures.5

Board member Mike Hutchinson, who is the current chair of the board’s budget & finance committee, had previously introduced a resolution to the board that included re-envisioning the school’s footprint and restructuring the district,6 but after strong opposition by the board chairperson and advocates, the resolution was not adopted.
Leadership is needed to right the ship and avoid state receivership
Re-envisioning the size of OUSD’s school footprint by reducing the number of school sites would require political will; leadership, communication, and empathy; and detailed operational planning and execution. Without a smooth transition for students and families, such closures and mergers could become a catalyst for more families leaving the district, and without a plan for what to do with the facilities they could easily fall into disrepair and be an ongoing cost that stays with the district.
However, failing to address the structural deficit means that OUSD will continue to be perpetually distracted as it moves from one financial crisis to the next. It also could result in a state takeover of the district and loss of local control over financial decision-making, as Alameda County Superintendent of Schools Alysse Castro previously warned the OUSD board.

OUSD budget staff now has until December 10 to present three new scenarios to the board, including one which removes all restrictions on which expense categories may be considered. While the timeline is extremely abbreviated, it will be the first chance to see how the OUSD superintendent, the chief business officer and budget staff propose addressing the deficit with a full set of tools at their disposal.
Future installments in this series will take a look into the backgrounds of the current board members, and the legal and political dynamics shaping their decision-making.
See these related articles:


District Profile - Oakland Unified. Education Data Partnership, Dec. 2, 2025. https://www.ed-data.org/district/Alameda/Oakland-Unified/ps_Mjk5MzI%5E
Oakland Unified School District. “Presentation of Budget Scenarios - OUSD Structural Deficit - Fiscal Years 2025-2026; 2026-2027.” OUSD board of education meeting, Oakland, California, Nov. 19, 2025, agenda item H-1. https://ousd.granicus.com/player/clip/2794?meta_id=1019365
Local Educational Agencies (LEA) and school-level data files. California Department of Education, Dec. 2, 2025. https://www.cde.ca.gov/ds/ad/filescupc.asp
Tadayon, Ali. “New Oakland Unified school board rescinds planned closure of five schools.” EdSource, Jan. 12, 2023. https://edsource.org/updates/oakland-unified-school-board-rescinds-previous-boards-decision-to-close-schools
Oakland Education Association. “The truth about school closures.” OEA, December 2024. https://oaklandea.org/wp-content/uploads/2024/12/OEA-Truth-About-School-Closures.pdf
Oakland Unified School District. “Meeting of the Board of Education.” Adoption by the Board of Education, upon recommendation by the Budget and Finance Committee, of Resolution No. 2324-0212 - Re-envision, Redesign, and Restructure of Oakland Unified School District In 2024-2025 Fiscal Year, As Amended. Oakland, California, June 26, 2024, agenda item #R-7. https://ousd.legistar.com/LegislationDetail.aspx?ID=6658332&GUID=CA353A48-DBB2-44D8-B31A-E44E8A140E61
You all are a treasure. THANK YOU.
I served on the OUSD board representing District 2 and have been involved in a range of Oakland school support nonprofit boards ever since. This article must be one of the most comprehensive, clear, and non-partisan summaries of the District’s budget and performance I have ever seen. Congratulations!
Given current board leadership, I would anticipate that the District will be back under state control by the end of the calendar year, with a trustee appointed by the County Superintendent.
Regarding the prior comment, District staff have done excellent analysis looking at projections of student-age population and school locations to develop scenarios for consolidations (merging schools sharing the same site) and closures. The District seems unable to articulate a vision for its schools that would (1) help parents of closed schools see the benefits, and (2) attract back the parents of private and charter school students.
By the way, the share of Oakland students in private schools has remained remarkably constant over the past decades, ranging from 11 to 15%. It’s the share in charter schools that has increased significantly, from 0% around 2000 to about 30% now. I do support charters as a reasonable alternative to traditional schools, but would prefer if the District included them in its facility planning rather ignoring their impact.