



Oakland Report examines the data behind the headlines. In this installment, we take a look at new national FBI data to again test Mayor Barbara Lee’s claim that crime in Oakland is down on her watch — and her inference that she deserves the credit.
Oaklanders have long suffered under one of the highest crime rates in the nation, even as crime has gone down overall in recent years — and trended downward nationwide.
Announcing the permanent appointment of police chief James Beere on July 29, mayor Barbara Lee celebrated the hire as an important continuation of the city’s crime reduction strategy — while seeming eager to frame Oaklanders’ concerns about crime as being as much about people’s feelings of safety as they are about the reality of crime on Oakland’s streets.1
“I am proud to appoint Chief James P. Beere to lead the Oakland Police Department. His appointment marks an important step as we continue building a safer Oakland where every resident feels secure and every neighborhood has the opportunity to thrive.”
— Mayor Barbara Lee, July 29, 2026
Yesterday the FBI published Crime in the United States, 2025, with new agency-level data that allow direct comparison between American cities.2
At the national level, the data was the best in decades: violent crime fell an estimated 9% nationwide, the largest single-year drop since the FBI began estimating in 1936, and property crime fell 12%.
Oakland’s own decline was steeper still. The city’s property crime rate fell 27% in a single year and 41% from its 2023 peak.
But even these laudable declines were not enough to dislodge Oakland from its standing as one of America’s most crime-impacted cities.
Oaklanders continue to experience the highest property crime rate in America — and the highest violent crime rate in California.
To help our readers understand the larger picture of Oakland’s crime trends, Oakland Report updated our August 2 analysis with the FBI’s new national city-level crime data to again assess where Oakland stands among other cities on the stated crime declines — not over two good years, but over the past 16 years.
Using Department of Justice (DOJ) crime data for 2025, we compared Oakland with other cities — and against statewide and national averages, from 2010 through 2025.
We also again examined clearance rates, the share of reported crimes police report solving.
Oakland Report is a citizen-led nonprofit organization. We present the evidence for our readers to decide what to think about it. Subscribe for free to get every analysis in your inbox.
Key findings
Oakland still has the highest property crime rate of any large city in America. In the FBI’s latest national city data (2025), Oakland again ranked first among all reporting cities over 100,000 residents.
Oakland also has the nation’s highest motor vehicle theft rate. Oakland’s rate was 1,448 per 100,000 residents in 2025 — 22% higher than second-place Kansas City and more than three times the national average of 459 per 100,000.
Oakland still has the highest violent crime rate of any California city. Oakland’s rate remains highest at every population threshold we tested: highest among the 369 reporting cities above 10,000 residents, and highest among the 76 cities above 100,000. Its violent crime rate is 44% above Stockton’s, the next-largest city in the top tier.
Three crime categories rose in Oakland between 2010 and 2025. Larceny-theft rose 70%, aggravated assault rose 37%, and motor vehicle theft rose 26%. Over the same period, California’s larceny rate fell 26% and its vehicle theft rate fell 23%.
Some crime categories have fallen sharply in Oakland. Burglary is down 57%, robbery 46% and homicide 44% since 2010 — in each case a steeper decline than the state’s.
Oakland reported clearing only one of the 6,431 vehicle thefts recorded in 2025. Oakland’s crime clearance rate (the share of reported crimes solved) was 0.02% — and its larceny-theft clearance rate was 0.1%. However, its homicide clearance rate (62%) was around average for large cities. The categories Oakland clears least are the categories that grew most.
Six crime categories rose in 2025 — the year Barbara Lee took office. Rape, attempted rape, arson, assaults with a knife, thefts from buildings, and bicycle thefts all increased from 2024 to 2025.
Oakland still has the highest property crime rate in America
When we published our previous analysis on August 2, the most recent national city-level comparison was the FBI’s 2024 crime data, and we noted that whether Oakland kept the top ranking would depend on how far other high-rate cities fell when the FBI released its 2025 data.3
The newly released 2025 crime data answers it. Oakland’s property crime rate of 5,225 per 100,000 remains the highest in the nation among cities with more than 250,000 residents — and also remains the highest of all U.S. cities with populations above 100,000.
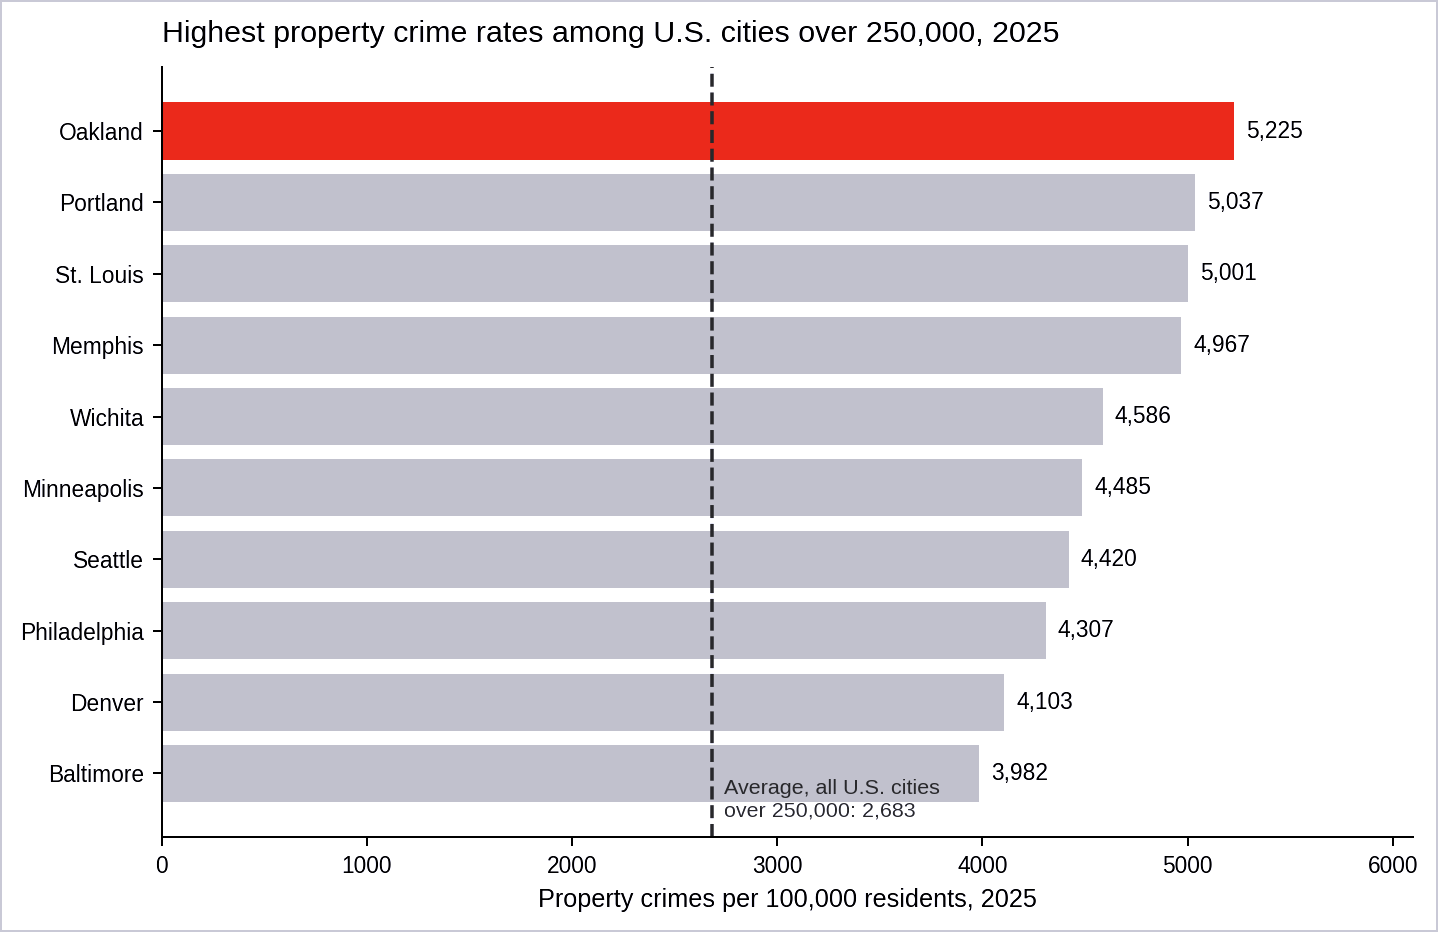
Oakland’s #1 ranking appears to have held because the cities with high crime rates, but still lower than Oakland’s, fell at a similar pace, not because Oakland stopped improving.
The FBI cautions against city rankings, and four large cities — Miami, Tampa, Jacksonville and New Orleans — did not report 2025 data.
Notably, New York and Atlanta, both of which did not report in 2024, did report in 2025 — with property crime rates of 2,273 and 3,100 per 100,000 residents, respectively. Neither approaches Oakland’s rate.
Oakland also has the nation’s highest vehicle theft rate
The crime category in which Oakland’s highest standing is most extreme is motor vehicle theft.
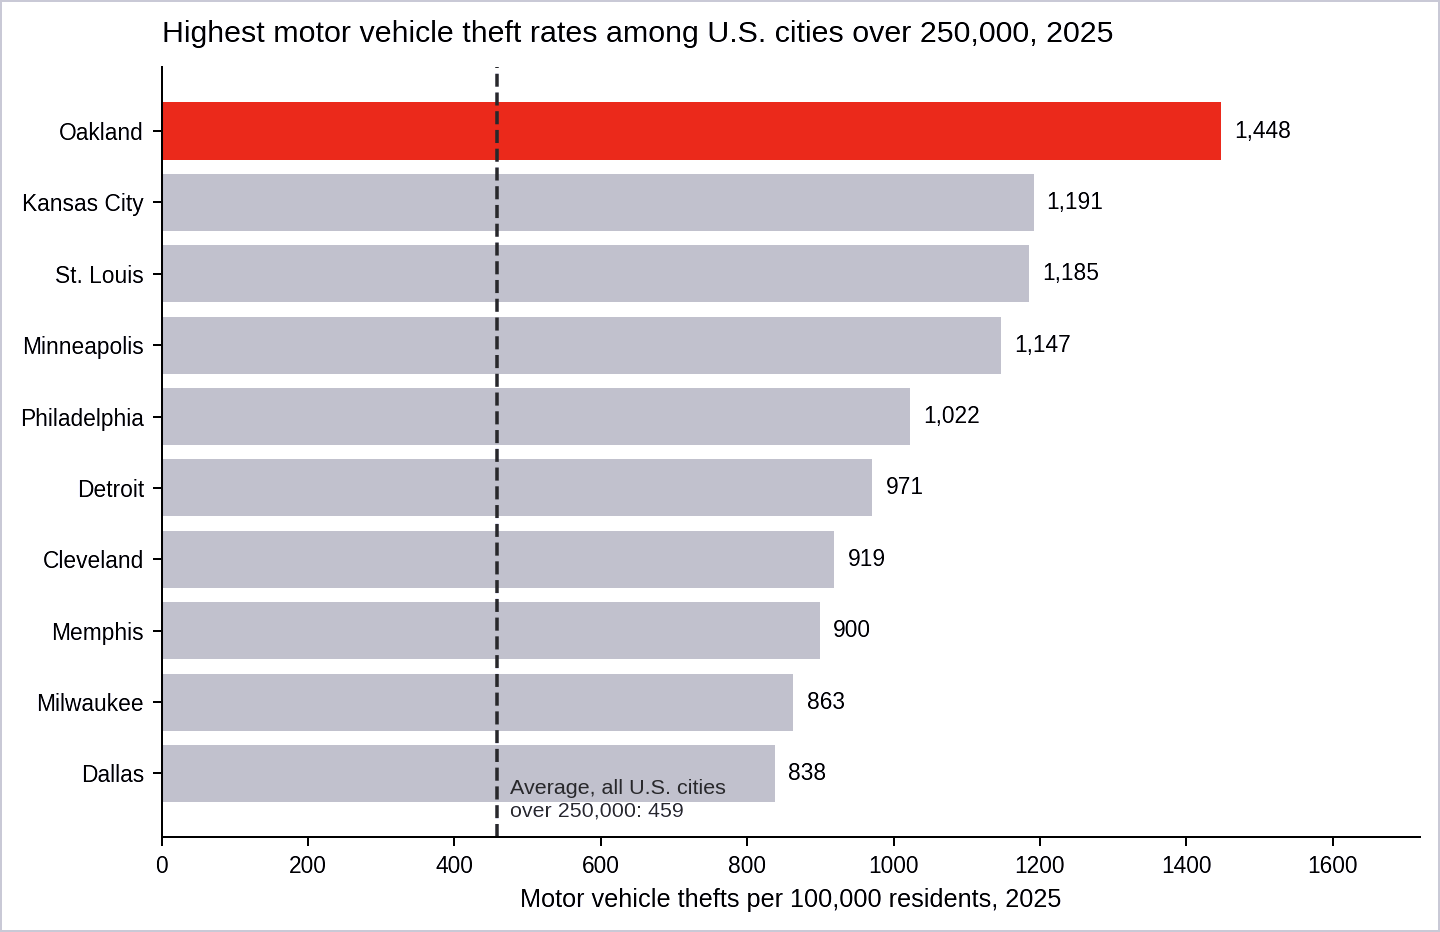
Oakland reported over 6,400 stolen vehicles in 2025 — a rate of 1,448 per 100,000 residents, according to the FBI’s population figure.
That is the highest of any large American city — 22% above second-place Kansas City and 3.2 times the average for cities over 250,000.
Vehicle theft in Oakland also rose over the long run. Oakland’s rate increased 26% since 2010, while California’s fell 23%.
Oakland now reports vehicle theft at about seven times the national rate and 4.6 times California’s rate.
Oakland still has the highest violent crime rate in California
Oakland’s violent crime rate of 1,475 per 100,000 residents is still the highest in California among cities with populations over 10,000 residents.
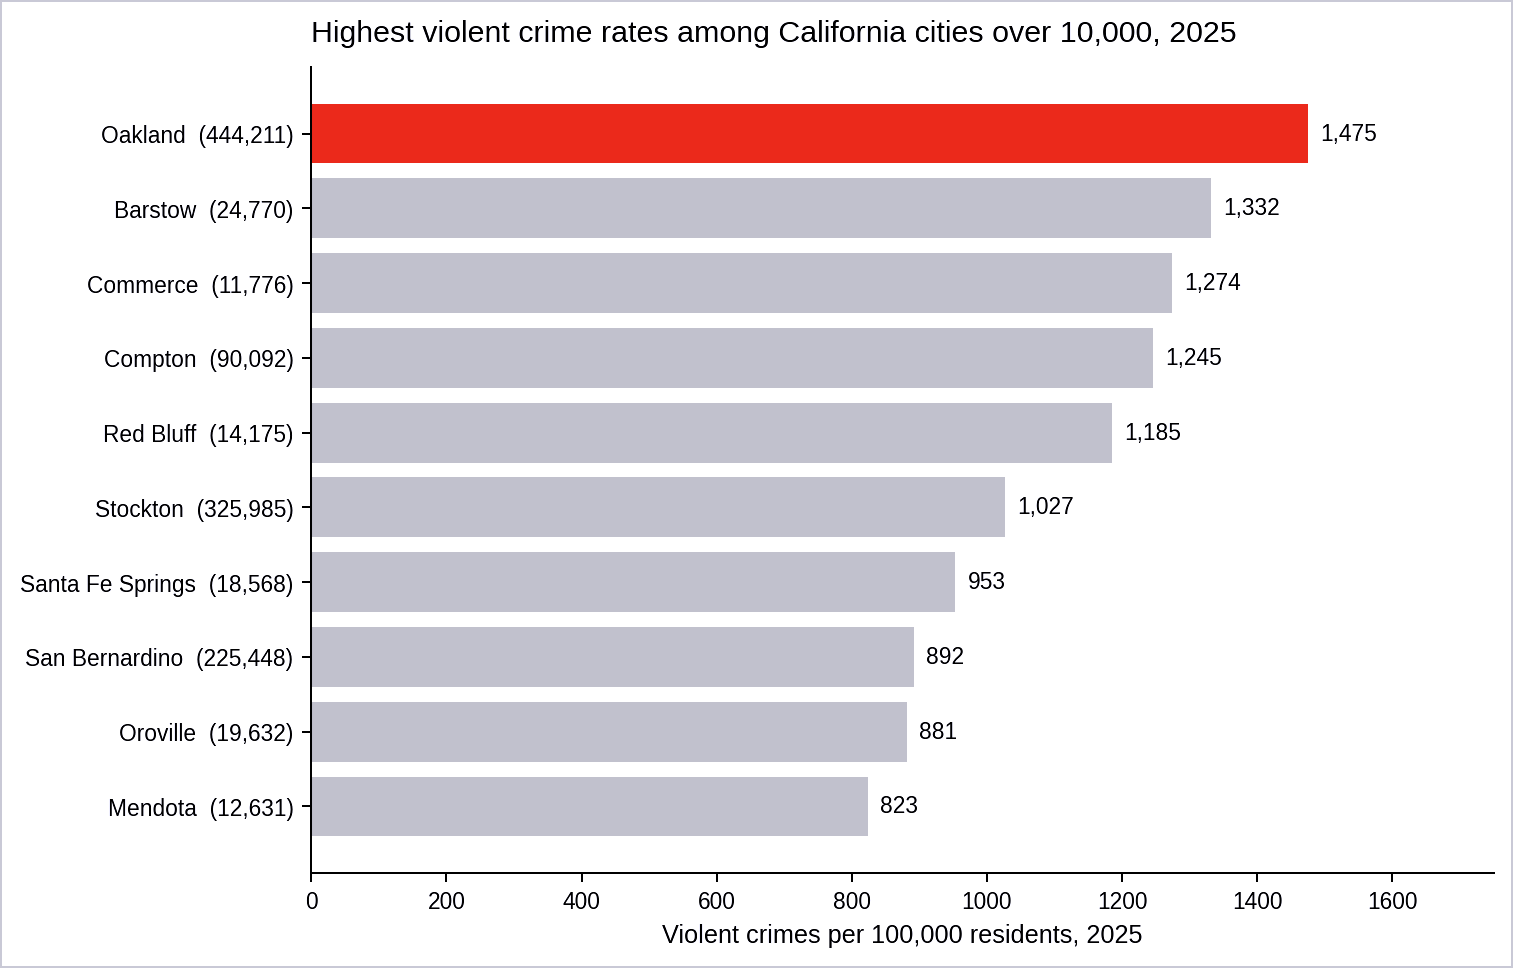
The California cities closest behind Oakland are far smaller. Barstow (population 24,800) reported 1,332 violent crimes per 100,000 residents and Commerce (11,800) reported 1,274 per 100,000.
Among cities of comparable size the spread is far greater: Stockton (population 326,000), reported 1,027 violent crimes per 100,000 residents — 44% below Oakland — and San Bernardino (population 225,400) reported 892 violent crimes per 100,000 residents.
The crime categories that rose are the categories Oakland isn’t clearing
A crime is “cleared” when police make an arrest and refer charges, or when an identified suspect cannot be charged for reasons outside police control.
Reading Oakland’s clearance rates alongside its crime trends produces a pattern that is difficult to ignore.
Oakland cleared 62% of its homicides in 2025 — below California’s 79% but close to the 69% average for U.S. cities over 250,000.
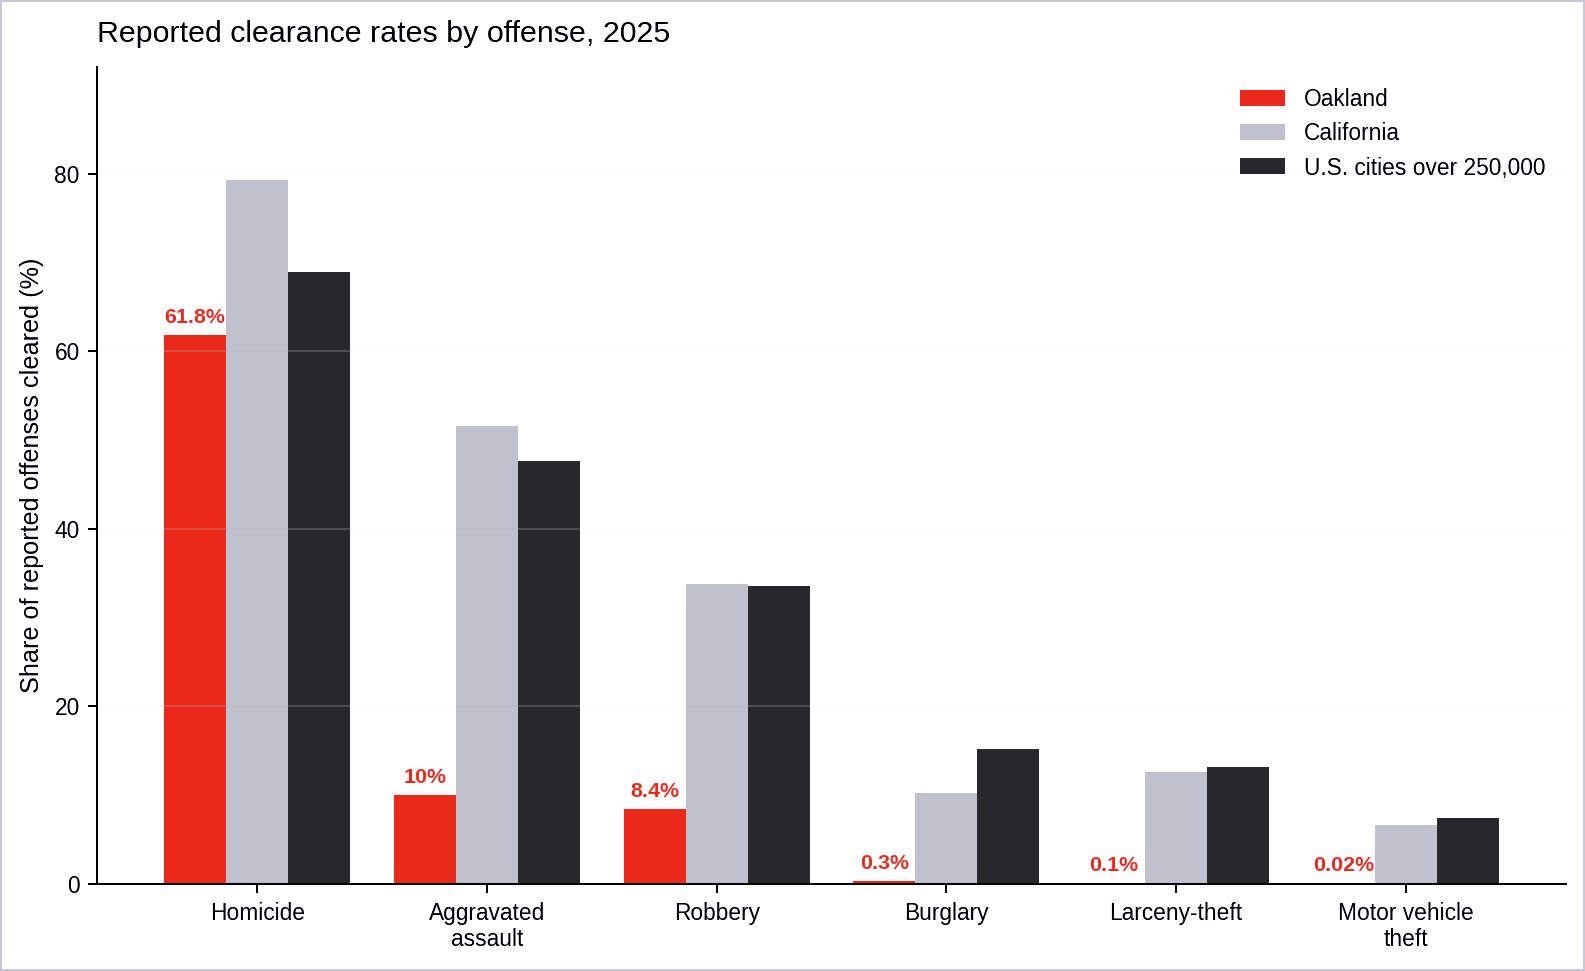
But in other categories, Oakland’s crime clearance rate lagged far behind other cities.
Aggravated assaults in Oakland were cleared at a rate of 10%, compared to 52% statewide.
Robbery clearances were at 8%, compared to 34% statewide.
Burglary clearances were 0.3%.
Larceny-theft clearances were 0.1% — 15 clearances against roughly 14,500 reported crimes.
In motor vehicle theft, Oakland reported only one clearance against around 6,400 reported thefts — a rate of 0.02%.
The three crime categories that rose in Oakland over 16 years are larceny-theft, aggravated assault and motor vehicle theft. Those are also, along with burglary, the categories Oakland reports clearing least.
The categories that fell — homicide, robbery, burglary — include the two categories Oakland clears at rates closest to the average for large cities.
It is reasonable to consider the possibility that these facts are related. Crime deterrence research generally finds that the probability of being caught matters more to offending than the severity of punishment — and a category cleared at 0.02% offers close to no probability at all.
It also stands to reason that a department facing over 23,000 reported property offenses with only around 546 active-duty officers — well below the 700 officers Oakland voters approved new taxes in 2024 to fund4 — may clear so few of these crimes because the crime volume is so high and the police department’s capacity is so low.
Note: These data cannot separate the two, and we do not claim they can.
One should not take the near-zero clearance figures entirely at face value
As we noted in our August 2 analysis, clearance numbers this close to zero may reflect breakdowns in how clearances are recorded and transmitted as much as investigative outcomes.
Two features of the 2025 data reinforce that possibility. Oakland’s reported robbery clearance rate increased from 0.5% in 2024 to 8.4% in 2025 — a seventeenfold change in one year, which seems more consistent with a reporting change than with a change in investigative practice.
A single clearance in a category with over 6,400 offenses (motor vehicle theft) is a figure that invites further scrutiny into Oakland’s reporting capacity and practices.
Notably, the city’s information technology department told the council’s public safety committee in July 2024 that Oakland’s police records system was vulnerable to outages and relied on an outdated method of transmitting crime statistics to federal authorities; the committee voted to replace it.5
What the clearance data support without qualification is the comparison at the top of the scale. Oakland’s homicide clearance rate is within range of its peers, but every other crime clearance category is far below both the state and the large-city average, and the gap is widest where Oakland’s crime counts have grown.
Six crime categories rose in 2025 — the year Barbara Lee took office
The recently released 2025 data shows that 35 of the 43 crime categories and subcategories significantly fell in Oakland between 2024 and 2025 — a welcome change, even as Oakland continued to have the highest violent crime rate in California for the 16th straight year.
Robbery with a firearm fell 50%, forcible-entry burglary fell 48%, street robbery fell 46%, and auto theft fell 35%.
But over the same period, six crime categories went up.
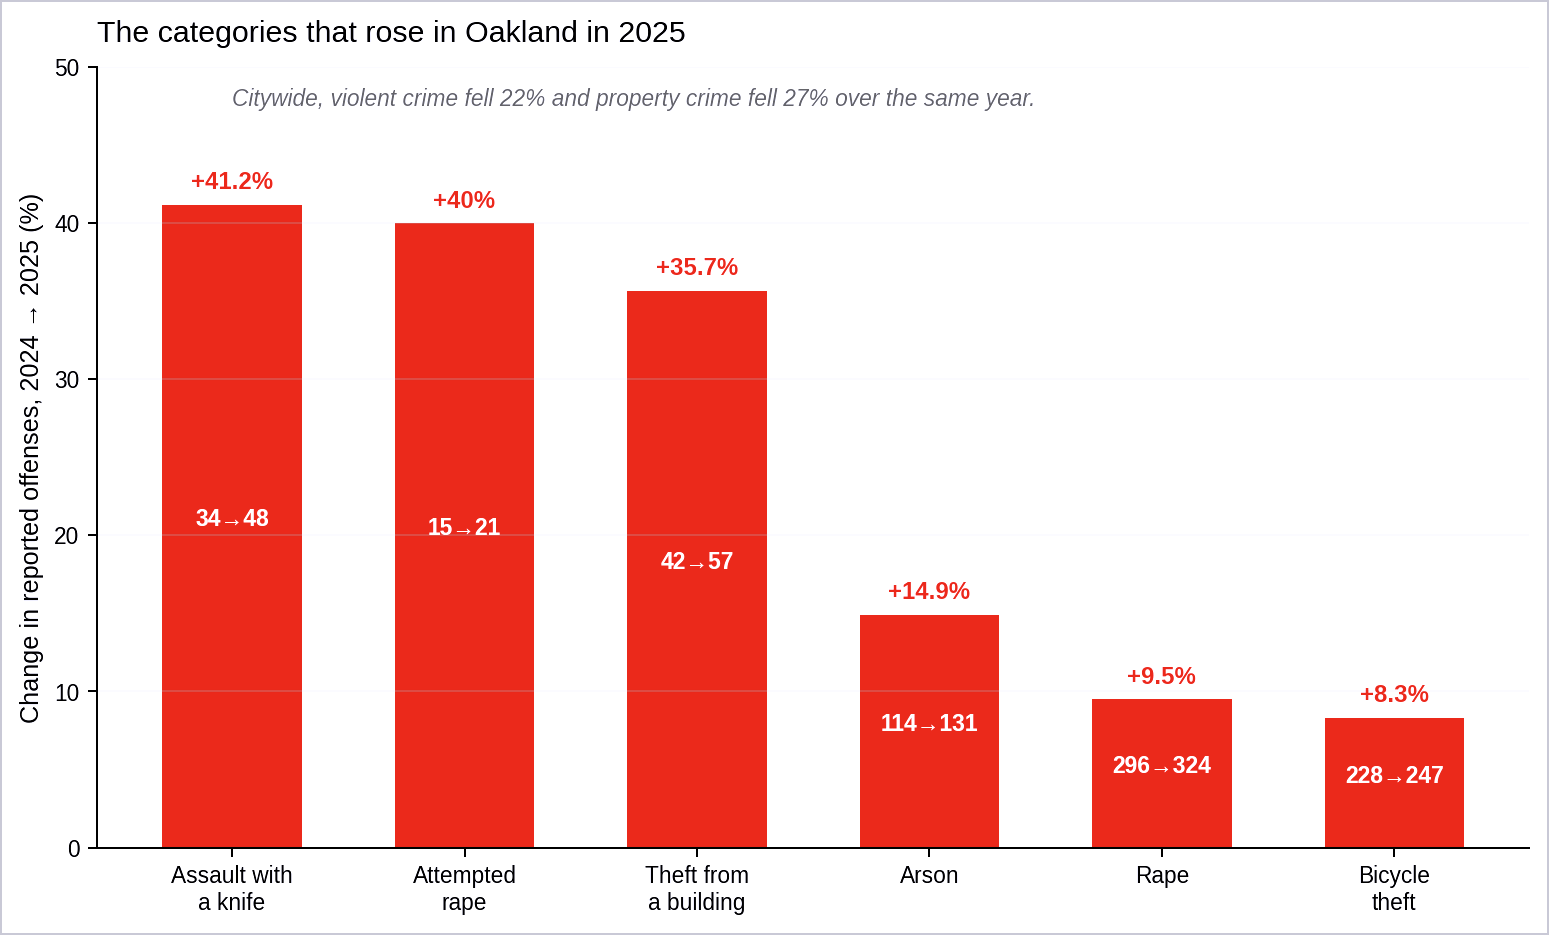
Rape in Oakland increased 9.5% in 2025. (Rape includes three subcategories measured at different levels — rape, and its two components, forcible rape and attempted rape.)
Arson rose 14.9%.
Assaults committed with a knife rose 41.2%, even as assaults with a firearm fell.
Thefts from buildings increased 35.7%.
Bicycle thefts rose 8.3%.
Attempted rape increased 40%
Forcible rape rose 7.8%.
Convenience-store robbery also increased but only slightly, from 116 to 118.
Barbara Lee was sworn in as mayor on May 20, 2025, and led the city for roughly seven and a half months of the year — a little over 60% of it.
Marking one year in office on May 20, 2026, mayor Barbara Lee told local television station KTVU that “crime rates are coming down in all categories.”6
Because a partial year invites unfair comparison in either direction, we compared crime data from the months of June through December in 2024 and 2025 — a timeframe when Lee held office in 2025 and her predecessors held office in 2024.
On that aligned comparison, the direction holds and in some cases sharpens: rape rose 13.7% , arson 19.4%, and knife assaults 8.0% in June-December 2025.
Two of the smaller increases reversed — thefts from buildings fell 3.7% and bicycle thefts were flat — indicating that those two were driven by the January-to-May period, before Lee took office.
However, over the same June-to-December window when Lee was in office, citywide violent crime fell 20.1% and property crime fell 22.1%.
We report the alignment because the timing is a fair question for readers to ask, not because these data can answer it. Nothing in this dataset establishes that a mayor’s tenure caused any of these movements, in either direction. As noted before, crime is declining overall nationwide.
Reported rape counts are influenced by victim reporting rates, advocacy, and investigative practice as much as by incidence. Arson counts turn partly on how fire investigators classify causes. The three smallest categories here involve raw count changes of 14 to 19 crimes, well within the range of ordinary year-to-year variation.
It seems unlikely that seven months of any administration could produce a measurable change in the underlying rate of these crimes at all. The same caution applies to the far larger declines Lee has cited in public statements.
If this kind of analysis is useful to you, consider a donation to Citizens Oakland, the 501(c)(3) nonprofit that supports our work.
Thank you.
Other considerations and counterpoints
A fair reading includes the following.
Oakland’s recent improvement is real, large, and faster than the nation’s — even as Oaklanders continue to suffer some of the highest crime rates in America. Its 27% single-year drop in property crime and a 22% drop in violent crime outpace the national declines of 12% and 9%.
Oakland’s violent crime rank improved from second to third highest among large American cities, and its 55 reported homicides in 2025 were its fewest on record.
Citywide rates also mask enormous neighborhood variation; a citywide average understates conditions in East and West Oakland flatland neighborhoods and overstates them in the hills.
Oakland polices a dense freeway-and-port geography with concentrated poverty that most comparison cities do not share, and it attempts to do so with roughly three-quarters of its budgeted sworn force actually active.
A ranking among reporting cities is not a ranking among all cities. Four large jurisdictions were absent from the 2025 federal data: Miami, Tampa, Jacksonville and New Orleans.
None of that changes the math. In the most recent year for which national comparison is possible, after the steepest two-year improvement in its recent record, Oakland reported more property crime per resident than any other large city in the United States, and the highest violent crime rate in California for the 16th straight year.
This analysis uses the same methodology and has the same caveats as our August 2 article, updated with the new 2025 crime data the FBI released yesterday.
Read this related article:

Is Oakland succeeding against crime? It depends on how you look at the data.
As noted above, mayor Lee told KTVU on May 20 that “crime rates are coming down in all categories.”
Video montage 1: Oakland mayor Barbara Lee claims that “crime rates are coming down in all categories” in a television interview on May 20, 2026. (Video sources: Instagram @mayorbarbaralee; KTVU. Montage by Oakland Report.)
The overall decline in crime to which the mayor referred is real — but it also is part of a nationwide trend. Oakland’s violent crime fell 22% in 2025 and its homicides fell 32%.
However, crime went up in some categories, and the mayor’s comments also did not address how Oakland’s crime rate compares to everywhere else.
In addition to having the highest property crime rate in the nation and the highest violent crime rate in the state, Oakland now reports the highest vehicle theft rate of any large city in the United States: 1,448 per 100,000 residents, 22% above second-place Kansas City and more than three times the average for cities over 250,000.
The mayor’s statements are technically accurate as stated, but they describe a city in which crime has fallen in several categories while eliding the fact that crime is declining nationwide — and the data which show that Oakland still has among the highest crime rates in the country.
Oakland’s property crime rate fell 26% in 2025, roughly double the state and national declines — yet Oakland still has the highest property crime rate in America.
Oakland’s violent crime rate fell 22% in 2025 — yet Oakland still has the highest violent crime rate in California.
Oakland’s 55 homicides reported by the FBI in 2025 were its fewest on record in decades — yet its homicide rate remains nearly four times the state average.
Over the longer term, the picture is even less favorable. Larceny-theft is up 70% since 2010, aggravated assault up 37%, and vehicle theft up 26%, while California’s rates fell in two of those three categories over the same period.
Reported thefts from vehicles in Oakland are up 343% since 2010. In 2025, Oaklanders reported over 17,000 crimes against vehicles — one for every 25 residents.
In addition, Oaklanders continued to experience a reported 90% chance that a violent crime would go unsolved.
The recent declines in many crime categories are heartening, and we hope they continue to decline.
Whether these new data from the FBI support the broader claim that “crime is down” in Oakland is for the reader to decide.

BECOME A SUPPORTING MEMBER
Oakland Report is an experiment in a new form of media. We are a citizen-led, nonprofit 501(c)(3) organization based in beautiful Oakland, California. If you value our work, please consider becoming a supporting membr. Your contribution in any amount helps us continue to produce articles like this one.
Lee, Barbara. “Appointing a Police Chief is one of the most important responsibilities I hold as Mayor, and today I had the honor of standing alongside James P. Beere as he was sworn in as Oakland’s new Police Chief.” Instagram / @mayorbarbaralee, Jul. 29, 2026. https://www.instagram.com/p/DbZOkGpj3eD
Federal Bureau of Investigation contributors. “Crime in the United States, 2025.” FBI, Aug. 14, 2026. https://cde.ucr.cjis.gov; https://www.fbi.gov/news/press-releases/fbi-releases-2025-reported-crimes-in-the-nation-statistics
Reinhart, Sean S. "Oakland has the #1 property crime rate in America." Oakland Report, Aug. 2, 2026. https://www.oaklandreport.org/p/oakland-highest-property-crime-in-america
Reinhart, Sean S. “Mayor Barbara Lee says meeting Measure NN’s minimum police staffing requirement now depends on voters approving a second parcel tax: Measure E.” Oakland Report, May 17, 2026. https://www.oaklandreport.org/p/mayor-barbara-lee-says-meeting-measure
City of Oakland. "Mark43 RMS upgrade for OPD." Council public safety committee meeting agenda, July 23, 2024. https://oakland.legistar.com/LegislationDetail.aspx?ID=6721126&GUID=063831BF-F02B-4FF4-B579-95845803DAE1&Options=&Search=
Senior, Andre et al. “One-on-one with Oakland Mayor Barbara Lee.” KTVU, May 20, 2026. https://www.ktvu.com/video/fmc-gqfz2zkr1rr3q8xk
Another great report by OR. Clearly OPD assigns priorities to certain crimes, hence the abysmal recovery rate for stolen cars. Staffing continues to be OPD’s Achilles heel, but closely flowing is OPD’s use of technology as a force multiplier. There are many tools available to enhance OPD’s abilities to police but due to budget, or more likely anti-police rhetoric, OPD is unable to institute these tools. Recently Oakland’s rogue Privacy Advisory Commission has been a blocking entity. That being said there’s a balance to policing and privacy rights and one must not look far to SF’s successes with the implementation of technology and ‘real time’ crime centers. If Oakland truly wants economic recovery its political leaders MUST evaluate and implement technologies that make Oakland not only safer but more economically viable. I have my doubts our current elected leadership has the political courage to do what is simply right for OPD and the citizens of our beloved city.
New Orleans didn't report to the FBI? So maybe Oakland is just... Number 2...?
Perceptions are as important as reality. When one sees violent lawlessness and street-level dysfunction, and one knows that calling 911 will get you a 4-minute hold time, a negative judgment is rendered that is very hard to reverse. The ingredients for a great city are all there, but the recipe needs adjustment, and the kitchen lacks a good cook.